
Development, characterization, and in vitro evaluation of TEMPO-oxidized microcellulose-based biomaterial inks for three-dimensional bioprinting

Three-dimensional (3D)-bioprinting is widely used in tissue engineering due to its customizability, avoidance of allogeneic rejection, and absence of disease transmission risk. Cellulose, a renewable natural polymer, is valued as an excellent bioink for its non-toxicity, biocompatibility, biodegradability, and cost-effectiveness. In this study, 2,2,6,6-tetramethylpiperidine-1-oxyl radical-oxidized microcellulose was subjected to homogenization. The resulting bioink was characterized using Fourier transform infrared spectroscopy, conductivity measurements, and rheometric analyses. Scaffolds were subsequently fabricated using 3D bioprinting, and cell viability was evaluated through cell culture on the printed scaffold. Optimization of the oxidation process revealed that a 6-h treatment achieved the highest degree of oxidation, exhibiting superior viscosity and printability compared to other durations. A straightforward scale-up of the 6-h process enabled the successful fabrication of 3D-bioprinted scaffolds. Cell culture experiments demonstrated excellent cell adhesion and viability on the scaffolds. Our findings demonstrate that oxidized microcellulose serves as a promising bio-based, non-toxic, structurally stable, and cell-compatible bioink for 3D bioprinting in tissue engineering applications.
1. Introduction
The utilization of three-dimensional (3D) bioprinting using hydrogel systems in tissue engineering (TE) has emerged as a pivotal solution to address the challenges associated with organ shortages and the repair of organ damage.1 TE has developed rapidly over the past two decades, aiming to restore the function of damaged tissues and organs. Significant advances have been made in skin TE, particularly in wound healing, through the development of structures or scaffolds that closely resemble the biological function of natural tissues, providing an alternative to full-thickness skin.2 These engineered skin substitutes are commonly used to enhance both functional and cosmetic outcomes, as well as to facilitate wound healing. In this field, biomaterials are primarily used to construct frameworks for medical applications, with the goal of enabling these structures to interact effectively with various biological components in the human body, including biomolecules, physiological fluids, organs, cells, and tissues of different sizes.3 Effective materials must possess appropriate physical properties suitable for their intended applications. For instance, soft tissue repair and artificial blood vessels require materials with high tensile strength to resist bending and tensile forces, while bone TE demands materials with optimal compressive strength to support and stabilize bone tissue. Additionally, to ensure appropriate interaction with biological tissues, these materials must have particular chemical properties, such as tailored surface chemistry, suited to the intended application.4,5 Hydrogels serve as an ideal choice, offering a biocompatible microenvironment akin to biological tissues due to their high-water content and soft texture.6 Compared to synthetic hydrogels, polysaccharides are widely regarded as promising biomaterials owing to their favorable properties, including biocompatibility, biodegradability, the presence of functional groups, and cytocompatibility. Moreover, carbohydrate units play a pivotal role in cell signaling, thereby facilitating cellular response processes.7 Furthermore, the porosity, mechanical properties, degradability, surface functionalization, and topology of modified polysaccharides can be extensively tailored in a predictable and reproducible manner through controlled processes.8 Hydrogels are particularly wellsuited for application to wound sites because of their processability, biodegradability, biocompatibility, and responsiveness to various stimuli (thermal, mechanical, and chemical).9 By mimicking the characteristics of the native extracellular matrix, hydrogels offer structural support for wound healing by creating an environment conducive to cell migration, adhesion, proliferation, and the promotion of key wound healing processes such as angiogenesis, collagen synthesis, and epithelialization. Hydrogels can be synthesized from a range of polymers, including natural polymers (e.g., agarose, alginate, carboxymethylcellulose, gelatin, fibrinogen, collagen); synthetic polymers (e.g., polyethylene glycol, polyvinyl alcohol); and hybrids (gelatin methacrylate, collagen methacryloyl, and many others).10 Among these, cellulose-based hydrogels have shown particular effectiveness in supporting organized tissue formation and enhancing wound healing.11
Cellulose, a structurally simple polysaccharide, is abundantly available in various natural sources, including plants such as cotton, budding plants, wood, and bamboo, as well as certain organisms like bacteria, fungi, and algae. Notably, both the original and chemically modified forms of cellulose are extensively used in TE due to their notable advantages. These benefits include high specific mechanical properties, non-immunogenicity, non-toxicity, widespread availability, and cost-effective production.12,13 Cellulose is composed of repeating β-D-glucose units linked by β-1,4-glycosidic bonds. Its structure is stabilized by numerous intra- and intermolecular hydrogen bonds, resulting in a plethora of hydroxyl groups along the cellulose chain. These hydrogen bonds confer unique stability, hydrophilicity, and abundant sites for chemical modification with various functional groups.14 Consequently, cellulose can undergo diverse modifications, yielding derivatives such as cellulose acetate, methylcellulose, ethyl cellulose, hydroxyethyl cellulose, and carboxymethyl cellulose. These modified cellulose variants are widely applied in biomedicine owing to their versatility and compatibility with biological systems.15 The presence of van der Waals forces within cellulose leads to a parallel aggregation phenomenon, facilitating the formation of crystalline nanofiber and microfiber structures. Its highly porous structure, along with its capacity to absorb and retain water, supports cell adhesion and proliferation. Due to its high biocompatibility, biodegradability, and non-allergenic properties,16,17 cellulose holds promise in applications such as skin and organ regeneration and cosmetic surgery.18 To enhance material performance, cellulose matrix composites are often developed through the combination of two or more compounds, creating tailored matrices with specific characteristics. The amalgamation of cellulose with various organic and inorganic compounds has been extensively investigated to regulate mechanical properties, biodegradation rates, bioactivity, and overall biological performance of scaffolds.19,20 In earlier studies, cellulose derived from plants often required pretreatment methods such as enzymatic hydrolysis, acid hydrolysis, or mechanical processing to produce nanocellulose and improve its functionality. However, these pretreatment processes consume significant amounts of energy and may lead to inefficiencies.21 To streamline the fabrication process and reduce associated costs, this study aims to fabricate TE scaffolds using microcellulose alone, without incorporating other compounds. However, prior to fabrication, cellulose requires chemical modification to enhance its performance.
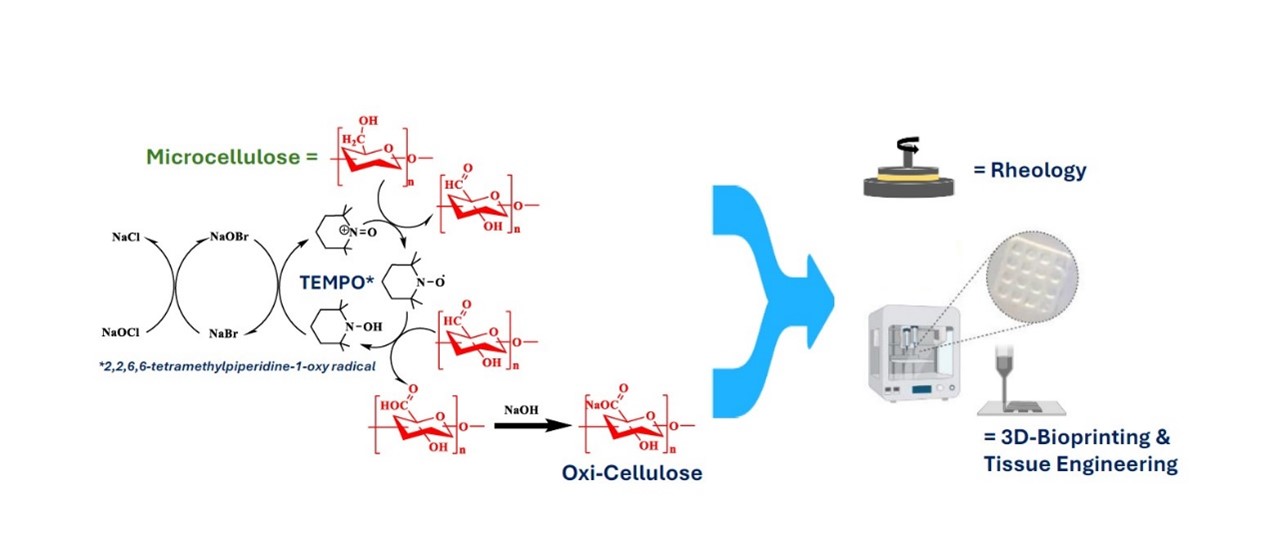
The oxidation process mediated by 2,2,6,6-tetramethylpiperidine-1-oxyl radical (TEMPO) selectively targets the primary hydroxyl groups of cellulose, leading to the conversion of the surface C6 hydroxyl groups into carboxyl groups.22 The oxidized cellulose then undergoes mechanical treatment to yield nanocellulose with reduced diameter. These nano-cellulose particles exhibit high viscosity owing to their excellent water solubility and possess the capability to cross-link with divalent metal ions, such as calcium ions, to form hydrogels.23 Cellulose nanofibers have demonstrated suitability for facilitating cell diffusion and maintaining phenotypic morphology, making them promising candidates for TE applications.24 Increasing the concentration of the hydrogel is a viable approach to enhance its mechanical strength. This adjustment also influences the rheological properties of the hydrogel, resulting in augmented storage modulus and viscosity, which contribute to improved mechanical performance.25 In the context of 3D bioprinting, the flow properties of the ink are paramount. Excessively rigid ink may impede the extrusion process, thereby compromising printing precision.
In this study, we synthesized oxidized microcellulose through TEMPO-mediated oxidation. We investigated the carboxyl content of oxidized microcellulose at various oxidation times and compared the viscoelastic properties and printability of samples, with differing carboxyl contents at different temperatures. Subsequently, we selected the oxidized cellulose exhibiting optimal rheological and mechanical properties for 3D bioprinting. Finally, we evaluated the keratinocyte cell viability of the printed scaffold to assess its potential applicability in TE.
This study introduces a significant advancement by markedly improving the degree of oxidation (from 20% to 67%) of cellulose while reducing the oxidation time from 24 to 6 h.26 Notably, the process eliminates the need for pretreatment methods such as mechanical grinding or chemical degradation, thereby reducing energy consumption.27 Structurally, cellulose, a polymer composed of glucose units linked by β-1,4 glycosidic bonds, serves as a structural analogue of polyglucuronic acid (PGU). Through TEMPO-mediated oxidation, cellulose is transformed into a cost-effective, functionally similar, and readily available bioink. Given the high cellulose content in agricultural by-products, this approach not only offers the efficient utilization of cellulose resources but also addresses environmental pollution by valorizing waste materials. Such advancements highlight the potential of cellulose as a sustainable raw material for bioink production in TE and related fields.28
2. Materials and methods
2.1. Materials
In this experiment, microcellulose (S3504 – 500G, 20 µm) was obtained from Sigma-Aldrich (France).29 It is extracted from cotton linters using a specific bleaching technique.30 Calcium chloride (anhydrous) was purchased from SRL Chemicals (India). Dulbecco’s phosphate buffered saline (10×) was procured from Sigma Aldrich (France). Pneumatic cartridges (3 mL) and 22G conical plastic nozzles for 3D printing were purchased from CELLINK (Sweden). Additional reagents included Dulbecco’s Modified Eagles Medium (DMEM, high glucose), fetal bovine serum, penicillin-streptomycin (Himedia, India), Gibco trypsin ethylenediaminetetraacetic acid (EDTA) (Himedia, India), and the Live/Dead cell imaging kit (Thermo Fisher, United States).
2.2. TEMPO oxidation
The TEMPO-sodium bromide (NaBr)-sodium hypochlorite (NaClO) system was utilized for oxidation, where primary alcohol groups in cellulose are converted into carboxyl groups.31 In the oxidation process, 6 g of microcellulose was dispersed in 90 mL of water, and the pH was adjusted to 10. The mixture was homogenized for 1 h. Separately, 0.05196 g of TEMPO and 1.152g of NaBr were dissolved in 10 mL of Milli-Q water and then added to the homogenized cellulose mixture. Next, 60 mL of 11.25% NaClO (calibrated prior to use) was slowly added dropwise to the mixture under constant stirring at 300 rpm using an automated system.32 The addition of NaClO initiated the oxidation reaction. The oxidation time ranged from three to 24 h. During this time, the pH was maintained between 10 and 10.5 using 10 M sodium hydroxide (NaOH). The NaClO addition took approximately 40 min. To stop the reaction, 60 mL of ethanol was added, and the mixture was stirred for 30 min. Then, 5 M hydrochloric acid (HCl) was added to neutralize the pH to 7. The solution was transferred to centrifuge tubes and centrifuged at 10,000 × g for 10 min at 4 °C. The resulting pellet was washed with 50 mL of ultrapure water at least five times. A conductivity meter was used to measure the salt concentration in the supernatant. Washing was continued until no further reduction in conductivity was observed, indicating the complete removal of salts from the solution. Once the conductivity stabilized (around 1 ms/cm), the washed pellet was stored at 4 °C for subsequent processing.
After characterizing cellulose oxidized over different durations, the optimal oxidation time was identified. This condition was then scaled up by a factor of 10. For scaleup, 60 g of microcellulose was dispersed in 900 mL of water, and the pH was adjusted to 10 using 10 M NaOH. To ensure complete dispersion of the cellulose, the mixture was homogenized for 1 h. Then, 0.5196 g of TEMPO and 11.52 g of NaBr were dissolved in 100 mL of Milli-Q water and added to the cellulose suspension. Then, 600 mL of 11.25% NaClO (calibrated prior to usage) was added to the mixture while maintaining constant stirring using an automatic system at 300 rpm. The addition of NaClO marked the beginning of the oxidation process. The oxidation lasted for 6 h, during which NaClO was slowly added dropwise. NaOH (10 M) was used to adjust the pH, maintaining it at 10–10.5 (the addition of NaClO was completed within 40 min). 600 mL of ethanol was added to stop the reaction, followed by stirring for 30 min. Then, 5 M HCl was added to neutralize the pH to 7. The solution was transferred to centrifuge tubes and centrifuged at 10,000 × g for 10 min at 4 °C. Subsequently, the pellet was washed with 500 mL of ultrapure water at least five times to ensure that the salt concentration in the supernatant stabilized. The final pellet was stored at 4 °C. The scale-up oxidized cellulose was then characterized to ensure optimal oxidation, with viscosity and oscillation results consistent with or better than those obtained prior to scale-up, as the goal of the scale-up process was to produce the best-oxidized cellulose for 3D bioprinting.
2.3. Mechanical treatment
This procedure was conducted to produce nanocelluloses and enhance the viscosity of the sample. ULTRA-TURRAX treatment was performed for 5 min, with a 1-min interval between each minute of operation. Following the 5-min ULTRA-TURRAX treatment, the viscosity of the sample was measured. The ULTRA-TURRAX machine was cleaned after each minute to ensure more accurate results. The speed was set at 11,000 rpm. After ULTRA-TURRAX treatment, the samples were freeze-dried and stored in a sealed bag at room temperature.
2.4. Transmittance analysis
The pellet obtained from washing the oxidized cellulose with water was subjected to ULTRA-TURRAX treatment. Subsequently, after treatment durations of 2, 4, and 6 min, the transparency of the oxidized polysaccharides, corresponding to different oxidation times, was measured using a spectrophotometer V-630 iRM Type (Jasco Europe, France) across the wavelength range of 200–800 nm. The absorbance values were expressed as T% (transmittance), where higher levels of transparency are advantageous for hydrogel preparation.
2.5. Fourier transform infrared spectroscopy analysis
The raw microcellulose sample, the oxy-cell sample, and the PGU (from BIOPI Laboratory, Institute of Physics, Pontifical Catholic University of Chile) were analyzed using a Fourier transform infrared spectrophotometer (Thermo Scientific Nicolet iS5, United States) equipped with an attenuated total reflectance accessory (Thermo Scientific iD7, United States). Spectra were collected within the range of 4000–500 cm−1 at a resolution of 4 cm−1, utilizing 32 scans and subjected to background subtraction (atmospheric spectra). Notably, a peak corresponding to the carboxyl group was observed at approximately 1600 cm−1.
2.6. Conductivity
A total of 0.2 g of oxidized cellulose was mixed with 100 mL of water and stirred at 350 rpm for 24 h. Subsequently, the mixture was treated using an ultrasonic processor (UP100H, Hielscher Ultrasound Technology, Germany) at 100% amplitude (100 W, 30 kHz) for 10 min.33 After sonication, oxidized cellulose was mixed with 1 mL of 0.1 M HCl, at 350 rpm for 1 h to homogenize. The samples were then titrated with 0.01 M NaOH, and conductivity values were recorded using Sension+ EC7 conductivity meter (Hach, India). The surface charge was calculated in millimoles per gram (mmol/g) using the following formula:
where c represents the NaOH concentration (in M), m denotes the mass of oxidized cellulose in the suspension (in g), and v is the volume of NaOH (in mL) used to neutralize the added HCl and the carboxylic acid groups on the oxidized cellulose.
The degree of oxidation was then calculated using the formula:
Here, 162 represents the molar mass of the glucose unit, 80 corresponds to the molar mass of the CH-COO-Na group, and 5 is a correction factor.
2.7. Rheological analysis
Rheological measurements were performed using a rheometer (AR-2000, TA Instruments, Great Britain) equipped with a conical plate comprising an upper cone with a diameter of 40 mm and an angle of 4°, along with a smooth lower cone of 40 mm diameter, with a gap of 52 μm. A portion of each sample was analyzed for viscosity using TA Instrument Rheology Advantage software (v5.7.0). The stable shear flow properties of cellulose solutions at concentrations of 2%, 4%, and 6% and various oxidation times were evaluated at both 25 and 4 °C using cone-plate geometry. The study encompassed a shear rate range from 0.01 to 100 s−1. All samples exhibited non-Newtonian behavior. The power-law fluid model was employed to fit the non-Newtonian shear rate data using the following formula:
where η represents the apparent viscosity, ji denotes the shear rate, K is the consistency index, and n is the flow behavior index.
A frequency sweep test was conducted over the range of 0.1–100 Hz at 5% strain. This test was employed to ascertain the relationship between the test frequency and the storage (G’) and loss (G”) moduli of the material.34 Additionally, it provides insight into the viscoelastic properties and state of the samples by comparing the G’ and G” values across the frequency range. A steady-state flow step was also performed at shear rates ranging from 0.01 to 100 s−1 to determine the sample viscosity. Both the frequency sweep and steady-state flow steps were conducted at temperatures of 4 and 25 °C.35
To further understand the viscoelastic behavior of the hydrogel during the printing process and to evaluate the extent of viscosity changes when the hydrogel was subjected to varying shear rates—similar to 3D printing conditions—a three-interval thixotropic test was performed. Briefly, the hydrogel sample was initially subjected to a low shear rate of 0.1/s for 60 s (simulating the resting state of hydrogel inside the cartridge), followed by a high shear rate of 100/s for 5 s (simulating the extrusion state). The recovery phase was then obtained by applying a shear rate of 0.1/s for 120 s, simulating the resting phase after printing. The recovery rate was calculated using the following formula:
2.8. Printability analysis
The 6% w/w oxycellulose hydrogel was loaded into a 3 mL pneumatic cartridge connected to a 22 G nozzle with an inner diameter of 0.410 mm and an outer diameter of 0.720 mm. The hydrogel was printed using an extrusion-based 3D bioprinter (BioX, CELLINK, Sweden). Scaffolds were printed with a dimension of 10 mm × 10 mm × 1 mm, consisting of three layers. A grid infill pattern was used with an infill density of 45%. The following printing parameters were optimized to ensure continuous filament formation: printing pressure (25 kPa), printing speed (5 mm/s), and both tool and print-bed temperatures maintained at 4 °C. After printing, the scaffolds were crosslinked using a 2% w/v calcium chloride solution (pH 7) for 2 h at room temperature. Following incubation, the scaffolds were washed up to five times with ultrapure Milli-Q water to remove excess or unreacted calcium ions. The washed scaffolds were then freeze-dried and used for further in vitro analysis.
The printability of the 3D-printed scaffolds was determined using Pr formula (Equation V).36 A Pr value between 0.9 and 1.2 indicates ideal gelation. Values below 0.9 indicate under-gelation, while values above 1.2 indicate over-gelation.
where C is the circularity of the scaffold, A is the area, and L is the perimeter. Circularity was calculated using the following equation:
2.9. Cell viability
The HaCaT (human keratinocyte cell line) was procured from the National Centre for Cell Science, India. The HaCaT cells were maintained in DMEM high-glucose media supplemented with 10% fetal bovine serum and 1% penicillin-streptomycin. The cells were maintained until they reached 90% confluency. They were then trypsinized using trypsin with 0.5% EDTA by adding 3 mL of trypsin and incubating at 37 °C for 3 min. After incubation, 7 mL of DMEM was added to the flask, followed by centrifugation at 300 rpm for 3 min. The supernatant was discarded, and the pellet was resuspended in 1 mL of DMEM media.
To determine the cell adhesion and proliferation properties of the 3D-printed oxycellulose scaffolds, the freeze-dried scaffolds were sterilized using 70% ethanol for 2 h. The scaffolds were then transferred into a 24-well plate (coated with 2% agarose), washed four times with sterile phosphate-buffered saline, and incubated overnight in 1 mL of DMEM media. Cells were then seeded at a density of 5 × 10³ cells per scaffold. Cell adhesion and proliferation were assessed on Days 0, 1, and 3 using a Live/Dead viability kit (calcein acetoxymethyl and ethidium homodimer). The stained scaffolds were then imaged using confocal microscopy (Olympus FV3000) at excitation wavelengths of 494 nm (calcein acetoxymethyl) and 528 nm (ethidium homodimer). All experiments were performed in triplicate to obtain statistically significant data.
Statistical analysis was conducted using analysis of variance, and when significant at p ≤ 0.05, Fisher’s least significant difference test (p ≤ 0.05) was used for mean comparisons.
3. Results and discussion
3.1. TEMPO oxidation
To ensure the stability of the TEMPO oxidation process, we optimized the volume of NaClO and limited the total NaClO addition time to 40 min. Additionally, the amount of NaOH was adjusted to between 4 and 4.5 mL, depending on the oxidation time. Theoretically, 2 M of NaClO and 1 M of NaOH are required to oxidize 1 M of the primary hydroxyl group of the glucose unit.21 After oxidation, salts (impurities) were removed through five consecutive 50 mL washes of the pellet with Milli-Q water. Following each wash, the supernatant was discarded, and its salt content was assessed via conductivity. A significant decrease in salt concentration was observed, from 76.9 g/L (initial supernatant concentration) to 0.523 g/L (after the fifth wash). The pellets were subsequently dried to calculate the yield of oxidized cellulose. The optimized oxidized cellulose yield after final oxidation was around 50–55%.
3.2. Fourier transform infrared spectroscopy analysis
The functional groups of the samples were analyzed using Fourier transform infrared spectroscopy (FTIR), as illustrated in Figure 1. The peak at 3412 cm−1 is attributed to the tensile vibration of the hydroxyl bond.37 The peak at 2900 cm−1 corresponds to the stretching vibration of the C–H bond.38 The key peak at 1642 cm−1, which we focused on, is attributed to the C–O stretch of the carboxyl group.39 The peak at 1000 cm−1 represents the C–H stretching vibration of the glycosidic bond,40 while the peak around 600 cm−1 is associated with the C–O stretching vibration of cellulose.41 Overall, our findings confirm the presence of carboxyl groups. By employing pelletized samples, we minimized stray peaks and retained prominent OH and COO– peaks. Despite only minimal variation in peak plots was observed across different oxidation times, FTIR alone did not clearly distinguish subtle differences in COO– content. Therefore, we conducted conductivity experiments for further investigation. The PGU map illustrates the position and content of the carboxyl group, as well as changes in functional groups after oxidation.

Figure 1. Fourier transform infrared spectroscopy spectra of oxidized microcellulose (Oxi-cell). Notes: From top to bottom, microcellulose without polyglucuronic acid (PGU; derived from Sinorhizobium meliloti M5N1CS) and samples oxidized with PGU for 3, 6, 9, and 24 h; %T, Transmittance.
3.3. Conductimetric titration
The charge associated with the carboxyl groups of TEMPO-oxidized cellulose fibers was determined through conductivity titration. The titration curve exhibited a retroparabolic relationship with the quantity of NaOH added in all oxidized samples. The initial decrease in conductivity reflects the neutralizing effect of HCl reacting with NaOH, independent of the material’s charge properties. After complete neutralization, conductivity stabilized, and NaOH consumption began to reflect the presence of carboxylic acid groups in the oxidized microcellulose. The sharp increase in conductivity observed in the later stages of titration indicates the accumulation of excess NaOH in the solution.42 In the titration of oxidized microcellulose (Figure 2), we observed that the degree of oxidation reached 62% after 3 h of TEMPO oxidation. After 6, 9, and 24 h of oxidation, the degree of oxidation increased to 67%. These findings suggest that the maximum degree of oxidation is achieved after 6 h of TEMPO oxidation of microcellulose. Meanwhile, to control for the potential influence of pH on the experiment, we conducted a cellulose control test without the TEMPO/NaBr/NaClO oxidation system (Figure S1, Supporting Information). All other conditions, including rotational speed, temperature, reaction time, cellulose mass, solution volume, and pH, were kept consistent with those of the oxidation reaction. The results demonstrated that no carboxyl group production formation occurred at pH 10 for durations ranging from 3 to 24 h (Table S1, Supporting Information). The microcellulose used in this study was also titrated, and no carboxyl groups were detected. To enhance the accuracy of the titration experiment, PGU was also subjected to titration. The results indicated the presence of 100% carboxyl groups in PGU, validating the reliability of our experimental method. Each sample was tested in triplicate, yielding consistent values with negligible error bars, further confirming the robustness and stability of the method (Table 1).

Figure 2. Conductivity analysis of microcellulose with and without 2,2,6,6-tetramethylpiperidine-1-oxyl radical oxidation, with bacterial polyglucuronic acid (PGU) used as a control for 100% carboxyl group. Abbreviations: calc, calculated; Oxi-cell, oxidized microcellulose.
Table 1. Degree of oxidation of microcellulose at different time points
| Sample name | Σ | Degree of oxidation |
|---|---|---|
| Oxi-cell 3 h | 0.000900 | 62% |
| Oxi-cell 6 h | 0.000975 | 67% |
| Oxi-cell 9 h | 0.000975 | 67% |
| Oxi-cell 24 h | 0.000975 | 67% |
| PGU | 0.001425 | 100% |
Abbreviations: Oxi-cell, oxidized microcellulose; PGU, polyglucuronic acid.
3.4. Rheological analysis
3.4.1. Viscosity
The viscosity results depicted in Figure 3A illustrate a gradual reduction in viscosity values with increasing shear stress, indicating the characteristic shear-thinning behavior commonly observed in pseudoplastic fluids within the realm of non-Newtonian fluids.43 The pseudoplastic nature of these fluids allows for control of viscosity by adjusting the extrusion speed of the nozzle, thereby facilitating optimal conditions for printing.44,45 The model parameters obtained through nonlinear regression at different oxidation times are presented in Table 2. The oxidized cellulose solutions, with oxidation times ranging from 3 to 24 h, exhibited shear-thinning characteristics, with flow behavior indices (n) less than 1. As the polymer’s oxidation time increased, the consistency index (K) increased, while the n value decreased. Moreover, the flow curves of oxidized cellulose solutions (3, 6, 9, and 24 h) showed significant linear correlations with the Ostwaldde Waele model, with coefficients of determination (R2 > 0.99). This indicates that the rheological behavior of TEMPO-oxidized cellulose solutions is well described by the power-law model across shear rates ranging from 0.01 to 100/s following at least 3 h of oxidation.46 Upon comparison, it was observed that the viscosity of the solution increased with oxidation time. The n value at 3 h of oxidation was the lowest, while the n value at 6–24 h of oxidation was higher and more consistent, reflecting a thicker consistency (with increased K). This trend aligns with the conductivity results. The viscosity index of the solution remained unchanged at both 4 and 25 °C (Figure S2, Table S2, Supporting Information). This observation suggests that the viscosity of oxidized cellulose is not significantly affected by temperature. As 6 h of oxidation achieved a sufficient degree of oxidation, this time point was selected for further investigation into concentration and mechanical treatment. Figure 3B illustrates the viscosity tests conducted on cellulose oxidized for 6 h at concentrations of 2%, 4%, and 6%. Table 3 presents the results of a nonlinear regression model analysis conducted on these samples. Increasing both concentration and ULTRA-TURRAX treatment amplified the values of K and R2 (>0.99), while the effect on n values remained uncertain. This implies that ULTRA-TURRAX treatment enhanced the pseudoplastic properties of oxidized cellulose, while preserving n values below 1, enabling the material to follow the power-law model. These findings are consistent with previously reported results.47 The analysis revealed a significant increase in solution viscosity with increasing concentration. Furthermore, we observed a notable increase in solution viscosity after ULTRA-TURRAX treatment. However, the effect of mechanical treatment on viscosity was found to be less pronounced than that of concentration. For instance, the viscosity of 4% oxidized cellulose after mechanical treatment was still lower than that of 6% oxidized cellulose without mechanical treatment.

Figure 3. Comparison of viscosity with different oxidation times and mechanical treatments. (A) Flow behavior of 2,2,6,6-tetramethylpiperidine-1-oxyl radical (TEMPO)-oxidized microcellulose aqueous solutions at concentrations of 6% (w/w) at different oxidation times of 3, 6, 9, and 24 h at 25°C. (B) Flow behavior of TEMPO-oxidized microcellulose aqueous solutions before and after ULTRA-TURRAX treatment (UT) at concentrations of 6%, 4%, and 2% (w/w) at 25°C after 6 h of TEMPO oxidation.
Table 2. Ostwald-de Waele model fitting parameters for 6% oxidized cellulose aqueous solutions at 25°C for 3, 6, 9, and 24 h of oxidation
| Sample name (viscosity) | n | K | R2 |
|---|---|---|---|
| 24 h-6% 25°С | 0.289 ± 0.018* | 8.574 ± 0.427* | 0.994 |
| 9 h-6% 25°С | 0.167 ± 0.023* | 14.72 ± 0.443* | 0.997 |
| 6 h-6% 25°С | 0.117 ± 0.033 | 9.965 ± 0.900* | 0.987 |
| 3 h-6% 25°С | 0.123 ± 0.042 | 1.344 ± 0.153 | 0.979 |
Notes: * represents that the data are significantly different from other data (p ≤ 0.05); K denotes the consistency index; n is the flow behavior index.
Table 3. Ostwald-de Waele model fitting parameters cellulose oxidized for 6 h at 25°C, before and after ULTRA-TURRAX treatment (UT), for 6%, 4%, and 2% aqueous solutions
| Sample name (viscosity) | n | K | R2 |
|---|---|---|---|
| 6 h-6% 25°С-UT | 0.121 ± 0.018* | 31.877 ± 1.534* | 0.996 |
| 6h-6% 25°С | 0.117 ± 0.033* | 9.965 ± 0.900* | 0.987 |
| 6h-4% 25°С-UT | 0.233 ± 0.023* | 9.608 ± 0.601* | 0.992 |
| 6h-4% 25 °С | 0.016 ± 0.043 | 4.041± 0.478* | 0.983 |
| 6h-2% 25 °С-UT | 0.171 ± 0.039* | 1.974 ± 0.207 | 0.980 |
| 6h-2% 25°С | 0.106 ± 0.042* | 1.178 ± 0.134 | 0.980 |
Notes: * represents that the data are significantly different from other data (p ≤ 0.05); K denotes the consistency index; n is the flow behavior index.
3.4.2. Printability using storage and loss moduli
Viscosity is often considered the primary factor influencing the extrudability of bioinks.48 However, in this study, we conducted a quantitative investigation of both components of the dynamic modulus, G’ and G”, as the viscosity of the solution increased to the point where it was nearly impossible to flow after mechanical treatment. As depicted in Figure 4A, a dynamic frequency sweep of G’ and G” was conducted over a range of 0.1–100 rad/s. The findings revealed that G’ consistently remains lower than G” across the entire angular frequency range, with both increasing as angular frequency increases. This is due to the fact that, at higher frequencies, the shorter duration of the material’s response to oscillatory forces reduces its energy dissipation and storage capacity per unit of time, thereby increasing both G’ and G”. A comparison of G’ and G” at different oxidation times revealed that the values at 3 h of oxidation were significantly lower than those at other oxidation durations, while the curves for longer oxidation times showed minimal variation. This indicates that the quantity of microcellulose produced after 3 h of oxidation is insufficient, resulting in inadequate rigidity and elasticity of the material at this stage. Additionally, the oscillation curves at 4 and 25 °C exhibited no significant differences, indicating that temperature had no discernible effect on oscillatory performance (Figure S3, Supporting Information). This observation aligns with the viscosity results. We also examined the impact of various concentrations and mechanical treatments on the oscillatory properties of cellulose oxidized for 6 h. Higher concentrations resulted in larger values of G’ and G”, indicating enhanced material strength and compressibility. Following sonication, G’ value increased, approaching or surpassing G”, suggesting a transition to a more solid-like state. At lower concentrations, the G” value of the material approached zero, indicating high elasticity (Figure 4B). Conversely, at 6% concentration, the G” value approached 1000 Pa, indicating that increasing concentration results in an increase in G’ and G” values, and thus greater elasticity, making the material more suitable for extrusion-based printing. These results demonstrate that the concentration of oxidized cellulose can be tailored for specific applications. This versatility expands the range of potential uses for these bioinks.

Figure 4. Comparison of oscillation with different oxidation times and mechanical treatments. (A) Storage modulus (G’), loss modulus (G”) against angular frequency (rad/s) of oxidized microcellulose aqueous solutions at a concentration of 6% (w/w) at different oxidation times of 3, 6, 9, and 24 h at 25°C. (B) G’ and G” against angular frequency (rad/s) of oxidized microcellulose aqueous solutions before and after ULTRA-TURRAX treatment (UT) at concentrations of 6%, 4%, and 2% (w/w) at 25°C after 6 h of oxidation.
The ratio of G” to G’ (tan δ) denotes the viscoelastic profile of the material, distinguishing between an elastic solid (G’ > G”, tan δ < 1) and a viscous liquid (G’ < G”, tan δ > 1).49 The interplay between G” and G’ significantly influences printability.48 A tan δ value exceeding 0.7 often leads to scaffold collapse, while a value below 0.2 results in filament inconsistency and poor extrusion.48,50Figure 5 illustrates tan δ plotted against angular frequency, revealing that tan δ value consistently remains below 1 across the tested frequency range, indicating that the material exhibits more elasticity than viscosity, thus remaining flowable.51 Moreover, the tan δ curves showed no discernible difference across temperatures, suggesting temperature variations do not affect the material’s solid or liquid state (Figure S4, Supporting information). A tan δ value greater than 0.5 for oxidation times of 3 and 6 h suggests weak elasticity with a shift toward viscous behavior, whereas values below 0.5 for oxidation times of 9 and 24 h indicate dominant elasticity. However, the tan δ values for all oxidized cellulose remained between 0 and 1, indicating a consistent blend of viscosity and elasticity. Following mechanical treatment and analysis of tan δ at different concentrations, it was observed that tan δ value decreases with increasing concentration, indicating a tendency toward solidification (Figure 5B). Additionally, mechanical treatment significantly reduced tan δ values, suggesting an enhancement in elasticity and a reduction in viscosity. Nevertheless, the tan δ values of oxidized cellulose before and after ULTRA-TURRAX remained between 0 and 1, confirming that the material consistently maintains both viscous and elastic properties. These findings underscore the potential of mechanical treatment to modulate the rheological properties of the material, offering insights into its flow behavior and suitability for various applications. The precision of 3D printing is dependent on the mechanical rigidity of the ink and the consistency of filaments generated by the bioink.52 As tan δ increases, the uniformity of extrusion lines improves. Conversely, lower tan δ values result in erratic extrusion lines. Adjustments in concentration and mechanical treatment can thus be guided by changes in tan δ, depending on the specific application requirements.

Figure 5. Comparison of Tan delta with different oxidation times and mechanical treatments. (A) Tan delta (degrees) versus angular frequency (rad/s) of 2,2,6,6-tetramethylpiperidine-1-oxyl radical (TEMPO)-oxidized microcellulose aqueous solutions at a concentration of 6% (w/w) at different oxidation times of 3, 6, 9, and 24 h at 25°C. (B) Tan delta (degrees) versus angular frequency (rad/s) of TEMPO-oxidized cellulose aqueous solutions before and after ULTRA-TURRAX treatment (UT) at concentrations of 6%, 4%, and 2% (w/w) at 25°С for 6 h of oxidation.
3.5. Scale-up of microcellulose TEMPO oxidation process
Based on the results of the characterization experiments, the optimal oxidation process (6 h) was selected. Subsequently, this process was scaled up 10-fold (60 g of microcellulose) to assess its feasibility for industrial production. The scale-up process entailed the steps outlined in Section 2.2. After scaling up, the material was re-characterized to ensure that its properties were equal to or better than those obtained during the initial testing. The next step, involving 3D bioprinting, focused on evaluating changes in viscosity and oscillation characteristics. The following results were obtained from rheological analysis. Before and after scaleup, the maximum viscosity of oxidized cellulose after 6 h was nearly 1000 Pa·s, demonstrating the stability of the process. In addition, the oxidized cellulose was freeze-dried and then redissolved to the same concentration to evaluate the effect of swelling on the material and ensure the quality of the ink. Both the oxidized cellulose solutions, before and after ULTRA-TURRAX treatment, as well as before and after swelling, exhibited shear-thinning behavior, with an n less than 1 (Figure 6A). Additionally, both swelling and ULTRA-TURRAX treatment increased K (Table 4). G’ and G” before and after swelling and ULTRA-TURRAX treatment of oxidized cellulose were assessed through a frequency sweep test at a constant strain of 5% and a temperature of 24°С. All samples (Figure 6B) exhibited frequency-dependent G’, with G’ consistently lower than G” at low frequencies, suggesting a predominance of elastic and flexible structures. Conversely, at high frequencies, G” > G’ indicates a more elastic and rigid structure, a common characteristic observed in many bioprinting materials.53 This shear-thinning characteristic is suitable for extrusion printing and supports continuous and uniform printing, even at high speeds.

Figure 6. Comparison of rheology after scale-up and mechanical treatments. (A) Flow behavior of cellulose aqueous solutions at a concentration of 6% (w/w) with 6 h of oxidation at 25°C, before and after ULTRA-TURRAX treatment (UT) and UT-freeze dried-swelling. (B) Oscillatory behavior of cellulose aqueous solutions at a concentration of 6% (w/w) with 6 h oxidation at 25 °C, before and after UT and UT-freeze dried-swelling. Abbreviations: Oxi-cell, oxidized microcellulose.
Table 4. Ostwald-de Waele model fitting parameters of 5.7% oxidized cellulose aqueous solution at 25 °C after 6 h of oxidation, before and after ULTRA-TURRAX treatment (UT) and swelling
| Sample name (viscosity) | n | K | R2 |
|---|---|---|---|
| 6 h-5.7% 25°С | 0.105 ± 0.043* | 7.906 ± 0.542 | 0.997 |
| 6 h-5.7%-UT 25°С | 0.235 ± 0.012* | 75.284 ± 2.604* | 0.997 |
| 6 h-5.7%-UT-swelling 25°С | -0.157 ± 0.092 | 8.080 ± 2.030 | 0.943 |
3.6. Gelation analysis
As carboxyl-containing polysaccharides often possess the ability to crosslink with divalent metal ions, the scaled-up oxidized cellulose (5.7% w/w concentration) with 5 min of ULTRA-TURRAX treatment was tested for crosslinking with 1 M calcium chloride (Figure 7). The inverted vial method revealed an increase in the viscosity of oxidized cellulose following crosslinking (Figure 7A). Additionally, visual inspection indicated whitening of the solution postcrosslinking, attributed to structural collapse induced by the crosslinking agent, resulting in a more compact network structure (Figure 7B).

Figure 7. Crosslinking analysis after ULTRA-TURRAX treatment. (A) 5.7% (w/w) oxidized microcellulose (900 μL) with 1 M calcium chloride (100 µL). (B) 5.7% (w/w) oxidized microcellulose (225 μL) with 1 M calcium chloride (25 µL) in Petri dish.
The results of the viscosity analysis showed that the viscosity of oxidized cellulose after crosslinking also exhibited a pseudoplastic curve. We also observed a fivefold increase in viscosity for oxidized microcellulose before (2581 Pa·s) and after (6868 Pa·s) crosslinking at a shear rate of 0.010. The addition of the crosslinker significantly enhanced the viscosity of the hydrogel (Figure 8A, Table 5). The addition of the crosslinker marked the completion of crosslinking, evidenced by the transition from G’ to G”, indicating the transformation of the solution from a liquid to a hydrogel, as depicted in Figure 8B. Complete crosslinking of 5.7% oxidized cellulose was achieved within 3 min.
Table 5. Ostwald-de Waele model fitting parameters of 5.7% oxidized cellulose aqueous solution at 25 °C after 6 h of oxidation, before and after crosslinking
| Sample name (viscosity) | n | K | R2 |
|---|---|---|---|
| 6 h-5.7%-UT 25°С | 0.235 ± 0.012 | 75.284 ± 2.604 | 0.997 |
| 6 h-5.7%-UT 25°С+CaCl2 | 0.257 ± 0.022 | 191.275 ± 11.75* | 0.991 |
Notes: * represents that the data are significantly different from other data (p ≤ 0.05); K denotes the consistency index; n is the flow behavior index.
Abbreviations: CaCl2, calcium chloride; UT, ULTRA-TURRAX treatment.

Figure 8. Crosslinking analysis after ULTRA-TURRAX treatment. (A) 5.7% (w/w) oxidized microcellulose (900 μL) with 1 M calcium chloride (CaCl2; 100 µL). (B) Tan delta (degrees) versus angular frequency (rad/s) for 5.7% (w/w) oxidized microcellulose (Oxi-cell).
The rheometric evaluation of the hydrogel was performed to assess its shear-thinning and thixotropic properties. The hydrogel was found to exhibit both properties, as shown in Figure 9. Moreover, from Figure 9, the hydrogel was found to recover 62% of its original viscosity. The viscoelastic behavior of the hydrogel during the 3D printing process was evaluated using a three-interval thixotropic test. The hydrogel exhibited suitable viscoelastic properties. However, it recovered only 62% of its original viscosity, indicating a loss in viscosity upon extrusion, with almost 40% of the initial viscosity lost after the printing process.

Figure 9. Oxidized cellulose hydrogel exhibiting thixotropic properties, which are important for three-dimensional printing applications.
3.7. Printability
The printability of the oxycellulose hydrogel was determined by evaluating the printed scaffolds for shape fidelity (Video S1, Supporting Information). As shown in Figure 10, 5.7% oxidized cellulose hydrogel demonstrated good strand formation at 80 kPa using a 22 G nozzle. The resulting filament produced well-defined structures during the printing process, with minor deformities at the edges that need further optimization. To further quantify printability, the Pr value was calculated. The Pr value obtained for the oxidized microcellulose hydrogel was 0.9, which falls within the ideal gelation range (between 0.9 and 1.2).

Figure 10. Oxidized microcellulose hydrogel (5.7%w/w) exhibiting (A) smooth filament formation using a 22 G nozzle and (B) well-printed structure with minor deformations at the edges.
3.8. Cell viability and adhesion
The cell viability and adhesion properties of the oxycellulose hydrogel were evaluated using HaCaT cell lines. Cell viability and adhesion play a vital role in the biomedical applications of 3D-printed structures. Upon sterilization, HaCaT cells were uniformly seeded on the scaffold. Cell viability of the scaffold was assessed using the Live/Dead cell viability kit, where live cells are stained green while dead cells appear red, as shown in Figure 11.

Figure 11. Cell viability on three-dimensional printed oxycellulose scaffolds at different time points. (A–C) Day 1, (D–F) Day 3, and (G–I) Day 7. Green indicates the live cells, and red indicates the dead cells on the scaffold. (A, D, G) Scale bars: 200 μm; magnification: 10×. (B, E, H) Scale bars: 2000 μm; magnification: 1.25×. (C, F, I) Scale bars: 200 μm; magnification: 10×. Abbreviation: 2D, two-dimensional.
Briefly, the cell-seeded scaffolds were imaged on Days 1, 3, and 7. For comparison, cells were seeded onto 2D culture plates. Cell morphology on two-dimensional culture plates consistently exhibited a spindle shape throughout the experimental period (Figure S5, Supporting Information; Figure 11A, D, and G). At 10× magnification, the morphology of the cells appeared consistent across all time points (Figure 11C, F, and I). However, in the case of our oxycellulose scaffold, cells were observed to form aggregates resembling spheroids, as shown in Figure 11C, F, and I. Such cellular aggregation has been reported in the literature for similar cellulose-based biomaterials.54,55 The main reason for this cellular aggregation could be the lack of sufficient cell adhesion moieties (e.g., amine functional groups) in plant-derived biomaterials.56,57 Additionally, the high viscosity of the oxycellulose hydrogel (106 mPa·s) may contribute to cell aggregation and decreased cell proliferation. In another study, a hydrogel composite of alginate and carboxymethyl cellulose was used to generate a liver cancer tissue model. It was reported that increasing the hydrogel’s viscosity beyond 1,000,000 mPa·s had an inverse effect on cellular viability.58
Biochemical factors depend on various parameters, including thickness, hydrophilic nature, rigidity, elastic modulus, and degradation behavior of the material. In a study conducted by Kumar et al.,59 cells seeded on a cellulose hydrogel exhibited a rounded morphology over a period of 14 days. Similarly, in Figure 12A–C, cells can be observed penetrating throughout the scaffold, thereby confirming the biocompatibility of the material.

Figure 12. Three-dimensional (3D) stack images showing cell viability on the 3D-printed oxycellulose scaffolds at different time points: (A) Day 1, (B) Day 3, and (C) Day 7. Scale bars: 200 μm; magnification: 10×.
We also conducted a comparative analysis of various bioinks, focusing on the crosslinking methods employed in TE applications (Table 6). We evaluated their cell viability, as well as the respective advantages and disadvantages associated with each bioink formulation. Ultimately, we advocate for the development of cellulose-based bioinks to effectively address the complexities inherent in diverse application scenarios.
Table 6. Comparison of various bioinks
| Polysaccharide based bio-ink | Crosslinking method | Cell viability | Bioprinting technique | Advantages | Disadvantages |
|---|---|---|---|---|---|
| Collagen | Hydrophobic bonding (0.5–60 min) | 46–99%60 61 | Extrusion-based, microvalve bioprinting; inkjet bioprinting; drop-on-demand and laser-based printing62 | Enhance cell function/attachment | Poor mechanical properties; rapid biodegradation63–65 |
| Gelatine | Temperature or glutaraldehyde (minutes to hours) | 70–99.7%66–68 | Extrusion-based, piezo-electric inkjet and two-photon polymerization69–71 | Excellent biocompatibilities and nonimmunogenicities | Poor mechanical properties and short degradation times72,73 |
| Alginate | CaCl2 (seconds) | 77–100%74 | Extrusion-based, microvalve bioprinting75 | Non-toxic crosslink; biocompatibility, biodegradability, and hydrophilicity | Poor stability and poor mechanical and barrier properties; heat treatment instability76 77 |
| Hyaluronic acid | Thiol group crosslink or UV light (15–30 min) | 64.4%78 | Extrusion-based, piezo-electric inkjet79 | Favorable properties of biocompatibility, inherent bifunctionality, nonimmunogenicity, versatility, and biodegradability | Poor mechanical properties and rapid degradation80 81 |
| Chitosan | pH (5–50 min) | ~75%82 | Extrusion-based | Favorable flexibility properties and non-toxic | Poor stability, poor mechanical properties, and difficulty in pore size control83 |
| Cellulose | Extrusion-based | Favorable water retention and high cell viability after printing; biocompatibility; reduced toxicity and high crystallinity; easily form high tensile strength gels | Poor dissolution and application limitations84,85 | ||
| Carrageenan | Thermoreversible gelation; ionic crosslinking;UV light (seconds to minutes) | <80%86 | Extrusion-based87 | Characterized by an abundance of functional groups for chemical modification, thus enhancing the physicochemical properties; possesses the favorable attributes such as biocompatibility, hemostatic ability, antioxidant properties, and immunomodulatory effects | Limited by the uncontrollable exchange of ions; has the potential to form a brittle hydrogel88 |
| Silk | Enzymatic and physical crosslinking | 70–96% 89 | Extrusion-based, inkjet bioprinting and microvalve bioprinting62 90 91 | Excellent printability and high resolution | Poor mechanical properties and unfavorable swelling behavior92 |
| Decellularized matrix | Thermal crosslinking and covalent crosslinking | ≥95%93 | Extrusion-based 94 | High cell viability and functionality | High cost95 |
| Methyl cellulose | Photo crosslinking (seconds) | 80–90%70 | Extrusion-based and micro-valve bioprinting75 | - | Can only be used as supporting material |
Abbreviations: CaCl2, calcium chloride; UV, ultraviolet.
4. Conclusion
In this study, microcellulose was effectively modified through TEMPO oxidation and transformed into an efficient hydrogel. The oxidation process was first optimized, identifying 6 h as the optimal duration. A subsequent 5-min ULTRA-TURRAX treatment considerably enhanced the biomaterial’s performance. A series of characterizations (FTIR, conductivity, rheology, injectability, and 3D-printability) were then conducted, leading to the development of a novel 3D bioink for the fabrication of a basic scaffold using a 3D bioprinter. Finally, the biocompatibility of this bio-based material was successfully validated through cell viability and adhesion experiments. To further improve cell adhesion and proliferation, future studies will explore the formulation of oxidized cellulose with nano-hydroxyapatite and gelatin for use as a 3D bioink. In summary, our materials show strong potential for applications in TE.
1.Ullah F, Othman MBH, Javed F, Ahmad Z, Akil HM. Classification, processing and application of hydrogels: a review. Mater Sci Eng C. 2015;57:414-433.
doi: 10.1016/j.msec.2015.07.053
2.Antezana PE, Municoy S, Álvarez-Echazú MI, et al. The 3D bioprinted scaffolds for wound healing. Pharmaceutics. 2022;14(2):464.
doi: 10.3390/pharmaceutics14020464
3.Wang J, Ma Y, Meng Q, et al. Photocrosslinked carboxymethylcellulose-based hydrogels: Synthesis, characterization for curcumin delivery and wound healing. Int J Biol Macromol. 2024;275:133558.
doi: 10.1016/j.ijbiomac.2024.133558
4.Mehrabi A, Jalise SZ, Hivechi A, et al. Evaluation of inherent properties of the carboxymethyl cellulose (CMC) for potential application in tissue engineering focusing on bone regeneration. Polym Adv Technol. 2024;35(1):e6258.
doi: 10.1002/pat.6258
5.Machado B, Costa SM, Costa I, Fangueiro R, Ferreira DP. The potential of algae as a source of cellulose and its derivatives for biomedical applications. Cellulose. 2024;31(6):3353-3376.
doi: 10.1007/s10570-024-05816-w
6.Gainza G, Villullas S, Pedraz JL, Hernandez RM, Igartua M. Advances in drug delivery systems (DDSs) to release growth factors for wound healing and skin regeneration. Nanomedicine. 2015;11(6):1551-1573.
doi: 10.1016/j.nano.2015.03.002
7.Radhakrishnan J, Subramanian A, Krishnan UM, Sethuraman S. Injectable and 3D bioprinted polysaccharide hydrogels: from cartilage to osteochondral tissue engineering. Biomacromolecules. 2017;18(1):1-26.
doi: 10.1021/acs.biomac.6b01619
8.Bolívar-Monsalve EJ, Alvarez MM, Hosseini S, et al. Engineering bioactive synthetic polymers for biomedical applications: a review with emphasis on tissue engineering and controlled release. Mater Adv. 2021;2(14):4447-4478.
doi: 10.1039/D1MA00092F
9.Budharaju H, Sundaramurthi D, Sethuraman S. Embedded 3D bioprinting - an emerging strategy to fabricate biomimetic & large vascularized tissue constructs. Bioact Mater. 2024;32:356-384.
doi: 10.1016/j.bioactmat.2023.10.012
10.Budharaju H, Subramanian A, Sethuraman S. Recent advancements in cardiovascular bioprinting and bioprinted cardiac constructs. Biomater Sci. 2021;9(6):1974-1994.
doi: 10.1039/d0bm01428a
11.Zennifer A, Senthilvelan P, Sethuraman S, Sundaramurthi D. Key advances of carboxymethyl cellulose in tissue engineering & 3D bioprinting applications. Carbohydr Polym. 2021;256:117561.
doi: 10.1016/j.carbpol.2020.117561
12.Zaman A, Huang F, Jiang M, Wei W, Zhou Z. Preparation, properties, and applications of natural cellulosic aerogels: a review. Energy Built Environ. 2020;1(1):60-76.
doi: 10.1016/j.enbenv.2019.09.002
13.Seddiqi H, Oliaei E, Honarkar H, et al. Cellulose and its derivatives: towards biomedical applications. Cellulose. 2021;28:1893-1931.
doi: 10.1007/s10570-020-03674-w
14.Wang Y, Qian J, Zhao N, Liu T, Xu W, Suo A. Novel hydroxyethyl chitosan/cellulose scaffolds with bubble-like porous structure for bone tissue engineering. Carbohydr Polym. 2017;167:44-51.
doi: 10.1016/j.carbpol.2017.03.030
15.Flávia Dias M-M, Cristina Duarte V-S. Cellulose and its derivatives use in the pharmaceutical compounding practice. In: Theo van de V, Louis G, eds. Cellulose. IntechOpen; 2013:Ch. 8.
doi: 10.5772/56637
16.Wahid F, Huang L-H, Zhao X-Q, et al. Bacterial cellulose and its potential for biomedical applications. Biotechnol Adv. 2021;53:107856.
doi: 10.1016/j.biotechadv.2021.107856
17.Torgbo S, Sukyai P. Biodegradation and thermal stability of bacterial cellulose as biomaterial: the relevance in biomedical applications. Polymer Degrad Stabil. 2020;179: 109232.
doi: 10.1016/j.polymdegradstab.2020.109232
18.Lahiri D, Nag M, Dutta B, et al. Bacterial cellulose: production, characterization, and application as antimicrobial agent. Int J Mol Sci. 2021;22(23):12984.
19.Oprea M, Voicu SI. Recent advances in composites based on cellulose derivatives for biomedical applications. Carbohydr Polym. 2020;247:116683.
doi: 10.1016/j.carbpol.2020.116683
20.Dutta SD, Patel DK, Lim KT. Functional cellulose-based hydrogels as extracellular matrices for tissue engineering. J Biol Eng. 2019;13:55.
doi: 10.1186/s13036-019-0177-0
21.Phanthong P, Reubroycharoen P, Hao X, Xu G, Abudula A, Guan G. Nanocellulose: extraction and application. Carbon Resour Convers. 2018;1(1):32-43.
doi: 10.1016/j.crcon.2018.05.004
22.Isogai T, Yanagisawa M, Isogai A. Degrees of polymerization (DP) and DP distribution of cellouronic acids prepared from alkali-treated celluloses and ball-milled native celluloses by TEMPO-mediated oxidation. Cellulose. 2009;16(1):117-127.
doi: 10.1007/s10570-008-9245-1
23.Masruchin N, Park B-D, Causin V, Um IC. Characteristics of TEMPO-oxidized cellulose fibril-based hydrogels induced by cationic ions and their properties. Cellulose. 2015;22(3):1993-2010.
doi: 10.1007/s10570-015-0624-0
24.Rashad A, Mustafa K, Heggset EB, Syverud K. Cytocompatibility of wood-derived cellulose nanofibril hydrogels with different surface chemistry. Biomacromolecules. 2017;18(4):1238-1248.
doi: 10.1021/acs.biomac.6b01911
25.Aarstad O, Heggset EB, Pedersen IS, Bjørnøy SH, Syverud K, Strand BL. Mechanical properties of composite hydrogels of alginate and cellulose nanofibrils. Polymers (Basel). 2017;9(8):378.
doi: 10.3390/polym9080378
26.da Silva Perez D, Montanari S, Vignon MR. TEMPO-mediated oxidation of cellulose III. Biomacromolecules. 2003;4(5):1417-1425.
doi: 10.1021/bm034144s
27.Miao X, Lin J, Tian F, Li X, Bian F, Wang J. Cellulose nanofibrils extracted from the byproduct of cotton plant. Carbohydr Polym. 2016;136:841-850.
doi: 10.1016/j.carbpol.2015.09.056
28.Daioglou V, Stehfest E, Wicke B, Faaij A, van Vuuren DP. Projections of the availability and cost of residues from agriculture and forestry. GCB Bioenergy. 2016;8(2):456-470.
doi: 10.1111/gcbb.12285
29.Qasim U, Ali Z, Nazir MS, et al. Isolation of cellulose from wheat straw using alkaline hydrogen peroxide and acidified sodium chlorite treatments: comparison of yield and properties. Adv Polym Technol. 2020;2020:9765950.
doi: 10.1155/2020/9765950
30.Wang F, Borjas A, Bonto A, et al. Exploring novel applications for hydrogels derived from modified celluloses. Polymers. 2024;16(4):530.
31.Tahiri C, Vignon MR. TEMPO-oxidation of cellulose: synthesis and characterisation of polyglucuronans. Cellulose. 2000;7(2):177-188.
32.Lasseuguette E. Grafting onto microfibrils of native cellulose. Cellulose. 2008;15(4):571-580.
doi: 10.1007/s10570-008-9200-1
33.Udoetok IA, Wilson LD, Headley JV. Ultra-sonication assisted cross-linking of cellulose polymers. Ultrasonic Sonochem. 2018;42:567-576.
doi: 10.1016/j.ultsonch.2017.12.017
34.Xu J, Kenar JA. Rheological and micro-rheological properties of chicory inulin gels. Gels. 2024;10(3):171.
doi: 10.3390/gels10030171
35.Stojkov G, Niyazov Z, Picchioni F, Bose RK. Relationship between structure and rheology of hydrogels for various applications. Gels. 2021;7(4):255.
doi: 10.3390/gels7040255
36.Schwab A, Levato R, D’Este M, Piluso S, Eglin D, Malda J. Printability and shape fidelity of bioinks in 3D bioprinting. Chem Rev. 2020;120(19):11028-11055.
doi: 10.1021/acs.chemrev.0c00084
37.Yadav C, Saini A, Maji PK. Energy efficient facile extraction process of cellulose nanofibres and their dimensional characterization using light scattering techniques. Carbohydr Polym. 2017;165:276-284.
doi: 10.1016/j.carbpol.2017.02.049
38.Rhim J-W, Reddy JP, Luo X. Isolation of cellulose nanocrystals from onion skin and their utilization for the preparation of agar-based bio-nanocomposites films. Cellulose. 2015;22(1):407-420.
doi: 10.1007/s10570-014-0517-7
39.Alemdar A, Sain M. Isolation and characterization of nanofibers from agricultural residues – wheat straw and soy hulls. Bioresour Technol. 2008;99(6):1664-1671.
doi: 10.1016/j.biortech.2007.04.029
40.Ahmadzadeh S, Desobry S, Keramat J, Nasirpour A. Crystalline structure and morphological properties of porous cellulose/clay composites: the effect of water and ethanol as coagulants. Carbohydr Polym. 2016;141:211-219.
doi: 10.1016/j.carbpol.2016.01.017
41.Rosa SML, Rehman N, de Miranda MIG, Nachtigall SMB, Bica CID. Chlorine-free extraction of cellulose from rice husk and whisker isolation. Carbohydr Polym. 2012;87(2):1131-1138.
doi: 10.1016/j.carbpol.2011.08.084
42.Jiang F, Han S, Hsieh Y-L. Controlled defibrillation of rice straw cellulose and self-assembly of cellulose nanofibrils into highly crystalline fibrous materials. RSC Adv. 2013;3:12366-12375.
doi: 10.1039/C3RA41646A
43.Jyoti BVS, Baek SW. Rheological characterization of ethanolamine gel propellants. J Energetic Mater. 2016;34(3):260-278.
doi: 10.1080/07370652.2015.1061617
44.Wan X, Luo L, Liu Y, Leng J. Direct Ink witing based 4D printing of materials and their applications. Adv Sci. 2020;7(16):2001000.
45.Guidetti M, Zampini MA, Jiang Y, et al. Axially- and torsionally-polarized radially converging shear wave MRE in an anisotropic phantom made via embedded direct ink writing. J Mech Behav Biomed Mater. 2021;119:104483.
doi: 10.1016/j.jmbbm.2021.104483
46.Ma J, Lin Y, Chen X, Zhao B, Zhang J. Flow behavior, thixotropy and dynamical viscoelasticity of sodium alginate aqueous solutions. Food Hydrocolloids. 2014;38:119-128.
doi: 10.1016/j.foodhyd.2013.11.016
47.Benaoun F, Delattre C, Boual Z, et al. Structural characterization and rheological behavior of a heteroxylan extracted from Plantago notata Lagasca (Plantaginaceae) seeds. Carbohydr Polym. 2017;175:96-104.
doi: 10.1016/j.carbpol.2017.07.056
48.Gao T, Gillispie GJ, Copus JS, et al. Optimization of gelatinalginate composite bioink printability using rheological parameters: a systematic approach. Biofabrication. 2018;10(3):034106.
49.Pugliese R, Beltrami B, Regondi S, Lunetta C. Polymeric biomaterials for 3D printing in medicine: an overview. Ann 3D Print Med. 2021;2:100011.
doi: 10.1016/j.stlm.2021.100011
50.Hernández-Sosa A, Ramírez-Jiménez RA, Rojo L, et al. Optimization of the rheological properties of self-assembled tripeptide/alginate/cellulose hydrogels for 3D printing. Polymers. 2022;14(11):2229.
51.Heggset EB, Strand BL, Sundby KW, Simon S, Chinga-Carrasco G, Syverud K. Viscoelastic properties of nanocellulose based inks for 3D printing and mechanical properties of CNF/alginate biocomposite gels. Cellulose. 2019;26(1):581-595.
doi: 10.1007/s10570-018-2142-3
52.Abouzeid RE, Khiari R, Beneventi D, Dufresne A. Biomimetic mineralization of three-dimensional printed Alginate/ Tempo-oxidized cellulose nanofibril scaffolds for bone tissue engineering. Biomacromolecules. 2018;19(11):4442-4452.
doi: 10.1021/acs.biomac.8b01325
53.Fermani M, Platania V, Kavasi R-M, et al. 3D-printed scaffolds from alginate/methyl cellulose/trimethyl chitosan/ silicate glasses for bone tissue engineering. Appl Sci. 2021;11(18):8677.
doi: 10.3390/app11188677
54.Teixeira Polez R, Huynh N, Pridgeon CS, Valle-Delgado JJ, Harjumäki R, Österberg M. Insights into spheroids formation in cellulose nanofibrils and Matrigel hydrogels using AFM-based techniques. Materials Today Bio. 2024;26:101065.
doi: 10.1016/j.mtbio.2024.101065
55.Kim HJ, Castañeda R, Kang TH, Kimura S, Wada M, Kim U-J. Cellulose hydrogel film for spheroid formation of human adipose-derived stemcells. Cellulose. 2018;25(4): 2589-2598.
doi: 10.1007/s10570-018-1732-4
56.Janmohammadi M, Nazemi Z, Salehi AOM, et al. Cellulose-based composite scaffolds for bone tissue engineering and localized drug delivery. Bioact Mater. 2023;20:137-163.
doi: 10.1016/j.bioactmat.2022.05.018
57.Buer Boyetey M-J, Torgbo S, Sukyai P. Bio-scaffold for bone tissue engineering with focus on bacterial cellulose, biological materials for hydroxyapatite synthesis and growth factors. Eur Polymer J. 2023;194:112168.
doi: 10.1016/j.eurpolymj.2023.112168
58.Badekila AK, Pai V, Vijayan V, Kini S. Engineering alginate/ carboxymethylcellulose scaffolds to establish liver cancer spheroids: evaluation of molecular variances between 2D and 3D models. Int J Biol Macromol. 2024;254:128058.
doi: 10.1016/j.ijbiomac.2023.128058
59.Kumar A, I Matari IA, Han SS. 3D printable carboxylated cellulose nanocrystal-reinforced hydrogel inks for tissue engineering. Biofabrication. 2020;12(2):025029.
60.Koch L, Deiwick A, Schlie S, et al. Skin tissue generation by laser cell printing. Biotechnol Bioeng. 2012;109(7):1855-1863.
doi: 10.1002/bit.24455
61.Rhee S, Puetzer JL, Mason BN, Reinhart-King CA, Bonassar LJ. 3D bioprinting of spatially heterogeneous collagen constructs for cartilage tissue engineering. ACS Biomater Sci Eng. 2016;2(10):1800-1805.
doi: 10.1021/acsbiomaterials.6b00288
62.Włodarczyk-Biegun MK, Del Campo A. 3D bioprinting of structural proteins. Biomaterials. 2017;134:180-201.
doi: 10.1016/j.biomaterials.2017.04.019
63.Gopinathan J, Noh I. Recent trends in bioinks for 3D printing. Biomater Res. 2018;22:11.
doi: 10.1186/s40824-018-0122-1
64.Caliari SR, Ramirez MA, Harley BAC. The development of collagen-GAG scaffold-membrane composites for tendon tissue engineering. Biomaterials. 2011;32(34):8990-8998.
doi: 10.1016/j.biomaterials.2011.08.035
65.Chan WW, Yeo DCL, Tan V, Singh S, Choudhury D, Naing MW. Additive biomanufacturing with collagen inks. Bioengineering (Basel). 2020;7(3):66.
doi: 10.3390/bioengineering7030066
66.Kang HW, Lee SJ, Ko IK, Kengla C, Yoo JJ, Atala A. A 3D bioprinting system to produce human-scale tissue constructs with structural integrity. Nat Biotechnol. 2016;34(3):312-319.
doi: 10.1038/nbt.3413
67.Kolesky DB, Truby RL, Gladman AS, Busbee TA, Homan KA, Lewis JA. 3D bioprinting of vascularized, heterogeneous cellladen tissue constructs. Adv Mater. 2014;26(19):3124-3130.
68.Billiet T, Gevaert E, De Schryver T, Cornelissen M, Dubruel P. The 3D printing of gelatin methacrylamide cell-laden tissue-engineered constructs with high cell viability. Biomaterials. 2014;35(1):49-62.
doi: 10.1016/j.biomaterials.2013.09.078
69.Hinton TJ, Jallerat Q, Palchesko RN, et al. Three-dimensional printing of complex biological structures by freeform reversible embedding of suspended hydrogels. Sci Adv. 2015;1(9):e1500758.
70.Lee BH, Lum N, Seow LY, Lim PQ, Tan LP. Synthesis and characterization of types A and B gelatin methacryloyl for bioink applications. Materials (Basel). 2016;9(10):797.
doi: 10.3390/ma9100797
71.Zhu K, Shin SR, van Kempen T, et al. Gold nanocomposite bioink for printing 3D cardiac constructs. Adv Funct Mater. 2017;27(12):1605352.
72.Wang X, Ao Q, Tian X, et al. Gelatin-based hydrogels for organ 3D bioprinting. Polymers (Basel). 2017;9(9):401.
doi: 10.3390/polym9090401
73.Guizzardi R, Vaghi L, Marelli M, et al. Gelatin-based hydrogels through homobifunctional triazolinediones targeting tyrosine residues. Molecules. 2019;24(3):589.
doi: 10.3390/molecules24030589
74.Jiang T, Munguia-Lopez JG, Flores-Torres S, et al. Directing the self-assembly of tumour spheroids by bioprinting cellular heterogeneous models within alginate/gelatin hydrogels. Sci Rep. 2017;7(1):4575.
doi: 10.1038/s41598-017-04691-9
75.Müller M, Öztürk E, Arlov Ø, Gatenholm P, Zenobi-Wong M. Alginate sulfate-nanocellulose bioinks for cartilage bioprinting applications. Ann Biomed Eng. 2017;45(1):210-223.
doi: 10.1007/s10439-016-1704-5
76.Abasalizadeh F, Moghaddam SV, Alizadeh E, et al. Alginatebased hydrogels as drug delivery vehicles in cancer treatment and their applications in wound dressing and 3D bioprinting. J Biol Eng. 2020;14:8.
doi: 10.1186/s13036-020-0227-7
77.Gheorghita Puscaselu R, Lobiuc A, Dimian M, Covasa M. Alginate: from food industry to biomedical applications and management of metabolic disorders. Polymers. 2020;12(10):2417.
78.Ouyang L, Highley CB, Rodell CB, Sun W, Burdick JA. 3D printing of shear-thinning hyaluronic acid hydrogels with secondary cross-linking. ACS Biomater Sci Eng. 2016;2(10):1743-1751.
doi: 10.1021/acsbiomaterials.6b00158
79.Poldervaart MT, Goversen B, de Ruijter M, et al. 3D bioprinting of methacrylated hyaluronic acid (MeHA) hydrogel with intrinsic osteogenicity. PLoS One. 2017;12(6):e0177628.
doi: 10.1371/journal.pone.0177628
80.Pérez LA, Hernández R, Alonso JM, Pérez-González R, Sáez-Martínez V. Hyaluronic acid hydrogels crosslinked in physiological conditions: synthesis and biomedical applications. Biomedicines. 2021;9(9): 1113.
doi: 10.3390/biomedicines9091113
81.Trombino S, Servidio C, Curcio F, Cassano R. Strategies for hyaluronic acid-based hydrogel design in drug delivery. Pharmaceutics. 2019;11(8):407.
doi: 10.3390/pharmaceutics11080407
82.Gu Q, Tomaskovic-Crook E, Lozano R, et al. Functional 3D neural mini-tissues from printed gel-based bioink and human neural stem cells. Adv Healthc Mater. 2016;5(12):1429-1438.
83.Croisier F, Jérôme C. Chitosan-based biomaterials for tissue engineering. Eur Polym J. 2013;49(4):780-792.
doi: 10.1016/j.eurpolymj.2012.12.009
84.Zainal SH, Mohd NH, Suhaili N, Anuar FH, Lazim AM, Othaman R. Preparation of cellulose-based hydrogel: a review. J Mater Res Technol. 2021;10:935-952.
doi: 10.1016/j.jmrt.2020.12.012
85.Sezer S, Şahin İ, Öztürk K, Şanko V, Koçer Z, Sezer ÜA. Cellulose-based hydrogels as biomaterials. In: Mondal MIH, ed. Cellulose-Based Superabsorbent Hydrogels. Springer International Publishing; 2019:1177-1203.
doi: 10.1007/978-3-319-77830-3_40
86.Bakarich S, Gorkin R, Naficy S, Gately R, in het Panhuis M, Spinks G. 3D/4D printing hydrogel composites: a pathway to functional devices. MRS Adv. 2016;1:521-526.
doi: 10.1557/adv.2015.9
87.Thakur A, Jaiswal MK, Peak CW, et al. Injectable shearthinning nanoengineered hydrogels for stem cell delivery. Nanoscale. 2016;8(24):12362-12372.
doi: 10.1039/c6nr02299e
88.Mokhtari H, Tavakoli S, Safarpour F, et al. Recent advances in chemically-modified and hybrid Carrageenan-based platforms for drug delivery, wound healing, and tissue engineering. Polymers (Basel). 2021;13(11):1744.
89.Rodriguez MJ, Brown J, Giordano J, Lin SJ, Omenetto FG, Kaplan DL. Silk based bioinks for soft tissue reconstruction using 3-dimensional (3D) printing with in vitro and in vivo assessments. Biomaterials. 2017;117:105-115.
doi: 10.1016/j.biomaterials.2016.11.046
90.Sommer MR, Schaffner M, Carnelli D, Studart AR. 3D printing of hierarchical silk fibroin structures. ACS Appl Mater Interfaces. 2016;8(50):34677-34685.
91.Suntivich R, Drachuk I, Calabrese R, Kaplan DL, Tsukruk VV. Inkjet printing of silk nest arrays for cell hosting. Biomacromolecules. 2014;15(4):1428-1435.
doi: 10.1021/bm500027c
92.Ciolacu DE, Suflet DM. 11 - cellulose-based hydrogels for medical/pharmaceutical applications. In: Popa V, Volf I, eds. Biomass as Renewable Raw Material to Obtain Bioproducts of High-Tech Value. Elsevier; 2018:401-439.
doi: 10.1016/B978-0-444-63774-1.00011-9
93.Jang J, Kim TG, Kim BS, Kim SW, Kwon SM, Cho DW. Tailoring mechanical properties of decellularized extracellular matrix bioink by vitamin B2-induced photocrosslinking. Acta Biomater. 2016;33:88-95.
doi: 10.1016/j.actbio.2016.01.013
94.Xavier JR, Thakur T, Desai P, et al. Bioactive nanoengineered hydrogels for bone tissue engineering: a growth-factor-free approach. ACS Nano. 2015;9(3):3109-31018.
doi: 10.1021/nn507488s
95.Jang J, Park H-J, Kim S-W, et al. 3D printed complex tissue construct using stem cell-laden decellularized extracellular matrix bioinks for cardiac repair. Biomaterials. 2017;112:264-274.