
An efficient adaptive exponentially weighted moving average chart for effective fault detection in the process mean

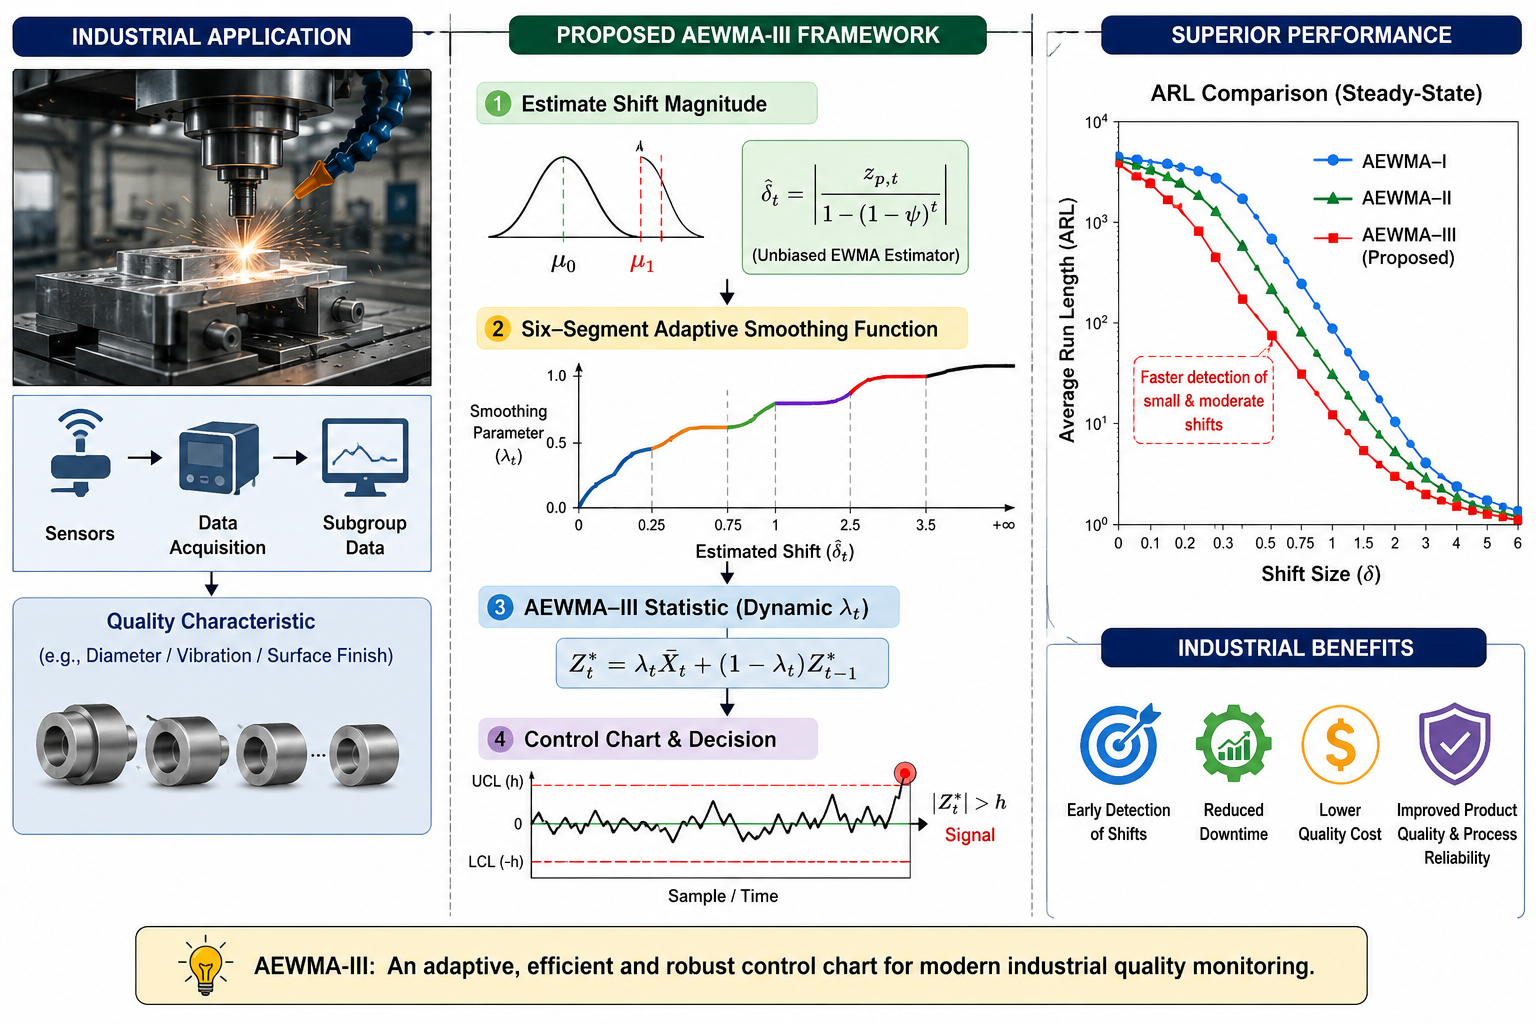
The exponentially weighted moving average (EWMA) control charts with adaptive charting structures have attracted attention from the research community for their dynamically adjusted smoothing parameters, which improve sensitivity to both small and large process shifts. Unlike a traditional EWMA chart, it can maintain stability in normal conditions and detect deviations quickly, thereby improving monitoring efficiency. In this study, we propose a memory-based control chart for the monitoring of the process mean of a normally distributed process. It estimates the mean shifts with an EWMA-based estimator and then finds the smoothing constant for plotting the EWMA statistics using a proposed continuous function. Monte Carlo simulations are conducted to evaluate the performance of the proposed adaptive EWMA (AEWMA) chart under different shifts in the process mean. The run-length profiles metric, along with overall performance measures, was used as a performance evaluation tool, and the proposed AEWMA chart outperformed the competing methods. A real data set from a semiconductor manufacturing process, where the quality characteristic of interest is the wafer flow width, illustrates the applicability in practice.
- Baranwal A, Kumar N, Chatterjee K, Koukouvinos C. A new EWMA chart for simultaneously monitoring the parameters of a shifted exponential distribution. J Appl Stat. 2025;52(1):221-252. https://doi.org/10.1080/02664763.2024.2363404
- Hayter AJ, Tsui K-L. Identification and quantification in multivariate quality control problems. J Qual Technol. 1994;26(3):197-208. https://doi.org/10.1080/00224065.1994.11979526
- Page E. Cumulative sum charts. Technometrics. 1961;3(1):1-9. https://doi.org/10.1080/00401706.1961.10489922
- Roberts S. Control chart tests based on geometric moving averages. Technometrics. 1959;1(3):239-250. https://doi.org/10.1080/00401706.2000.10485986
- Noor-ul-Amin M, Javaid A, Hanif M, Dogu E. Performance of maximum EWMA control chart in the presence of measurement error using auxiliary information. Commun Stat-Simul Comput. 2022;51(9):5482-5506. https://doi.org/10.1080/03610918.2020.1772301
- Riaz M, Abbas Z, Nazir HZ, Akhtar N, Abid M. On designing a progressive EWMA structure for an efficient monitoring of silicate enactment in hard bake processes. Arab J Sci Eng. 2021;46:1743-1760. https://doi.org/10.1007/s13369-020-04948-y
- Rasheed Z, Khan M, Anwar SM, Aslam MU, Lone SA, Almutlak SA. Designing an efficient adaptive EWMA model for normal process with engineering applications. Ain Shams Eng J. 2024:102904. https://doi.org/10.1016/j.asej.2024.102904
- Capizzi G, Masarotto G. An adaptive exponentially weighted moving average control chart. Technometrics. 2003;45(3):199-207. https://doi.org/10.1198/004017003000000023
- Ahmadini AA, Abbas T, AlQadi H. Adaptive EWMA Control Chart by Adjusting the Risk Factors through Artificial Neural Network. Qual Reliab Eng Int. 2025;41(3):992-1001. https://doi.org/10.1002/qre.3696
- Zhao J, Gao L, Huang B, et al. Dynamic monitoring of voltage difference fault in energy storage system based on adaptive threshold algorithm. IEEE; 2020:2413-2418. https://doi.org/10.1109/EI250167.2020.9347044
- Noor‐ul‐Amin M, Noor S. An adaptive EWMA control chart for monitoring the process mean in Bayesian theory under different loss functions. Qual Reliab Eng Int. 2021;37(2):804-819. https://doi.org/10.1002/qre.2764
- Sabahno H, Amiri A, Castagliola P. A new adaptive control chart for the simultaneous monitoring of the mean and variability of multivariate normal processes. Comput Ind Eng. 2021;151:106524. https://doi.org/10.1016/j.cie.2020.106524
- Noor-ul-Amin M, Sarwar MA, Emam W, Tashkandy Y, Yasmeen U, Nabi M. Adaptive multivariate dispersion control chart with application to bimetal thermostat data. Sci Rep. 2023;13(1):18137. https://doi.org/10.1038/s41598-023-45399-3
- Aytaçoğlu B, Driscoll AR, Woodall WH. Design of adaptive EWMA control charts using the conditional false alarm rate. Qual Reliab Eng Int. 2023;39(6):2206-2214. https://doi.org/10.1002/qre.3324
- Centofanti F, Lepore A, Palumbo B. An Adaptive Multivariate Functional Control Chart. Technometrics. 2025;67(4):603-616. https://doi.org/10.1080/00401706.2025.2491369
- Haq A, Gulzar R, Khoo MB. An efficient adaptive EWMA control chart for monitoring the process mean. Qual Reliab Eng Int. 2018;34(4):563-571. https://doi.org/10.1002/qre.2272
- Sarwar MA, Noor‐ul‐Amin M. Design of a new adaptive EWMA control chart. Qual Reliab Eng Int. 2022;38(7):3422-3436. https://doi.org/10.1002/qre.3141
- Zaagan AA, Khan I, Alzahrani ARR, Ahmad B. Parameter free AEWMA control chart for dispersion in semiconductor manufacturing. Sci Rep. 2024;14(1):10512. https://doi.org/10.1038/s41598-024-61408-5
- Naveed M, Azam M, Khan N, Aslam M, Saleem M, Saeed M. Control chart for half normal and half exponential power distributed process. Sci Rep. 2023/05/27 2023;13(1):8632. https://doi.org/10.1038/s41598-023-35884-0
- Jones CL, Abdel‐Salam ASG, Mays DA. Novel Bayesian CUSUM and EWMA control charts via various loss functions for monitoring processes. Qual Reliab Eng Int. 2023;39(1):164-189. https://doi.org/10.1002/qre.3229
- Jiang W, Shu L, Apley DW. Adaptive CUSUM procedures with EWMA-based shift estimators. Iie Trans. 2008;40(10):992-1003. https://doi.org/10.1080/07408170801961412
- Abbas T, Riaz M, Javed B, Abujiya MaR. A new scheme of dispersion charts based on neoteric ranked set sampling. AIMS Math. 2023;8(8):17996-18020. https://doi:10.3934/math.2023915
- Erto P, Pallotta G, Mastrangelo CM. A semi‐empirical Bayesian chart to monitor Weibull percentiles. Scand J Stat. 2015;42(3):701-712. https://doi.org/10.1111/sjos.12131
- Gandy A, Kvaløy JT. Guaranteed conditional performance of control charts via bootstrap methods. Scand J Stat. 2013;40(4):647-668. https://doi.org/10.1002/sjos.12006
- Centofanti F. Statistical Process Monitoring Based on Functional Data Analysis. Wiley Interdiscip Rev Comput Stat. 2026;18(1):e70057. https://doi.org/10.1002/wics.70057
- Grimm TR, Newhart KB, Hering AS. Nonparametric Threshold Estimation of Autocorrelated Statistics in Multivariate Statistical Process Monitoring. J Chemom. 2025;39(2):e70004. https://doi.org/10.1002/cem.70004
- Abbas T, Nazir HZ, Husssain Z, Abbas Z, Akhtar N. An Adaptive EWMA Dispersion Control Chart Basedon Robust Estimators Under Ranked Set Sampling. J Prime Res Math. 2026:11-27. https://jprm.sms.edu.pk/index.php/jprm/article/view/580
- Toktaş P, Gebizlioğlu ÖL. Modeling the dependency structure between quality characteristics in multi-stage manufacturing processes with copula functions. Int J Optim Control Theor Appl. 2024;14(4):404. https://doi.org/10.11121/ijocta.1594
- Anwar SM, Almakayeel N, Lin C-Y. Efficient monitoring of exponential processes using memory control charts for healthcare applications. Sci Rep. 2026. https://doi.org/10.1038/s41598-026-47544-0
- Bayati M, Nasrollahzadeh S, Bameni Moghadam M. Robust Monitoring of Multivariate Location Using a New Nonparametric Depth‐Based Control Chart. J Appl Math. 2026;2026(1):2550562. https://doi.org/10.1155/jama/2550562
- Montgomery DC. Introduction to statistical quality control. John wiley & sons; 2019.