

3D bioprinting with high-viscosity bioinks: A custom-designed extrusion head for high-resolution cellulose acetate scaffolds

Additive manufacturing holds significant potential in the field of tissue engineering, particularly for healing, replacing, and regenerating damaged or diseased tissues. However, the high cost of commercially available bioprinters and the limited availability of suitable biomaterials for bioprinting have hindered its widespread implementation and practical application in clinical settings. The aim of this study was to identify printing parameters tailored to the viscosity of the bioink and the evaporation characteristics of the organic solvent used in its formulation, with the broader goal of developing a cost-effective and accessible bioprinting platform for scaffold fabrication. To this end, we present a novel approach involving the design and fabrication of a cost-effective three-dimensional (3D) bioprinter conversion kit, developed using commercially available 3D printers. Bioprinting high-viscosity bioinks present specific challenges due to their resistance to flow and a high tendency to clog printing nozzles; however, this issue was mitigated through comprehensive rheological characterization. By leveraging the favorable properties of cellulose acetate as the chosen biomaterial, scaffold fabrication via 3D bioprinting was achieved efficiently without the need for curing or post-processing steps. Furthermore, a parametric troubleshooting procedure was developed to optimize printing parameters, elucidate the material behavior, and improve scaffold resolution, as assessed through scanning electron microscopy. Additionally, preliminary cell culture studies were carried out to evaluate the influence of the printed scaffolds’ biophysical cues on cellular responses, including adhesion and proliferation. This innovative and cost-effective solution has great potential to support researchers in tissue engineering and facilitate further exploration of advanced bioprinting techniques.
1. Introduction
Tissue engineering offers a therapeutic alternative to traditional tissue grafts through the fabrication of polymer-based scaffolds that mimic the physiological properties of the native tissue. Both synthetic and naturally derived polymers have been used to support the regeneration of new tissue.1 Synthetic polymers, such as thermoplastics, often exhibit limited cellular affinity and require surface modifications to promote cell adhesion, in contrast to natural polymers.2–4
Cellulose, a natural polysaccharide, is an eco-friendly and abundant material with the potential to replace conventional synthetic polymers such as poly(lactic acid) (PLA) and poly(ethylene terephthalate).5 Among cellulose derivatives, cellulose acetate (CA) is considered particularly valuable due to its biocompatibility, biodegradability, water insolubility, and excellent mechanical, chemical, and thermal resistance properties.6 Cellulose has become increasingly important in biomedical research, with numerous advancements enhancing its suitability for various biomedical applications, particularly in drug delivery systems, tissue engineering, and sutures.7 A wide range of cellulosic scaffolds—both in pristine and composite forms—have been developed, including films,8 electrospun fibers,9 and hydrogels.10 These scaffolds have demonstrated significant potential in tissue engineering applications, especially in wound healing,11 cardiovascular repair,12 and bone regeneration.13 Studies have revealed that CA-based scaffolds not only support cell adhesion,14 but also promote osteogenic differentiation,15 making them promising alternatives to conventional biomaterials used in bone tissue engineering. These scaffolds offer structural integrity alongside bioactivity. Moreover, CA has a low environmental and carbon footprint, aligning with circular economy principles and sustainability-driven material selection strategies.16,17
Despite these beneficial properties, the printability of cellulosic composites remains challenging. This is partly due to a limited understanding of CA’s rheological behavior—critical for optimizing bioprinting parameters— and its susceptibility to thermal decomposition.18 These factors complicate the development of reliable methods for fabricating 3D-printed cellulose-composite scaffolds.
Scaffolds suitable for implantation must possess specific characteristics related to the biomaterial of choice, such as biocompatibility, biodegradability, non-toxicity, and the absence of immunologic responses.19 Additionally, they should exhibit important structural features—such as conformational architecture, porosity, topographical features, and mechanical strength—that mimic the extracellular environment of cells in vivo. This is based on the ability of cells to “sense” the extracellular matrix (ECM) and external mechanical cues and to convert these signals into biochemical responses through a process called mechanotransduction.20,21
Over the past years, various fabrication methods— ranging from conventional techniques such as solvent casting and electrospinning to more recent additive manufacturing approaches—have been utilized to fabricate desirable scaffolds with ECM-like porosity and conformational architecture.22,23 Among these, three-dimensional (3D) bioprinting stands out for its ability to generate 3D scaffolds with specific geometries and architectures that influence cellular and nuclear mechanics, as well as other responses.24–26
Additive manufacturing is a pioneering fabrication technique that enables the efficient and cost-effective production of high-performance prototypes and structures. With broad applications across the automotive, aerospace, and healthcare industries, additive manufacturing techniques offer swift prototyping, reduced component weight, and minimal material waste at an affordable cost. The use of a bioprinter in place of a conventional 3D printer to a bioprinter—achieved by converting from fused deposition modeling (FDM) to fluid deposition modeling (fluid-DM)—introduces new capabilities within additive manufacturing for biomedical applications.
In this study, we present a custom-designed, extrusion-based, piston-driven bioprinting head. Composed primarily of 3D-printed parts, the system is easily optimizable for universal compatibility with commercially available 3D printers. Its piston-driven mechanism allows the extrusion of high-viscosity bioinks, enabling the processing of material compositions that are typically beyond the capabilities of current pneumatic bioprinting systems.27 Furthermore, through experimental characterization of the CA bioink—using rheological analysis and scanning electron microscopy (SEM)—we identify optimal parameters for printing high-resolution 3D scaffolds.
Scaffolds are commonly based on high-viscosity materials; however, their processing is complicated and often prone to instabilities (e.g., stick-slip effects) that lead to defective products (e.g., distorted extrudates). In this context, the use of bioinks in volatile solvents appears promising. As the solvent gradually evaporates during printing, the viscosity increases, while the formation of an external cellulosic-rich film—upon contact with air— stabilizes the extrudate. This mechanism, further explored in this study, offers a promising avenue for improving printing performance.
Several printability challenges—such as nozzle clogging, optimization of printing speed, symmetry of printed lines, and solvent evaporation phenomena (e.g., shrinkage)—were investigated and optimized, resulting in the successful fabrication of high-quality CA 3D scaffolds. Importantly, the printing process occurs at room temperature, eliminating the need for advanced and costly instrumentation.28 Although evaporation during printing must be accounted for, it can also confer benefits, as discussed in the subsequent sections.29
Finally, the bioprinting head is capable of printing bio-derived materials without structural damage and supports direct cell extrusion, enabling the incorporation of cells within the printed constructs.30,31 As mentioned above, the goal of regenerative medicine and tissue engineering is to develop substrates that mimic native tissue architecture and function. Given the outstanding mechanical properties of CA,32 the scaffolds produced using this bioprinting head demonstrate considerable promise for bone tissue engineering applications. To evaluate the biomedical relevance of this system, the 3D-printed scaffolds were cultured with mouse mesenchymal stem cells (MSCs). Preliminary cellular data, obtained via SEM and confocal microscopy, demonstrate the potential of both the bioprinter and the material for future applications across various biomedical fields.33,34
2. Materials and methods
2.1. Cellulose acetate as the polymer for scaffold fabrication
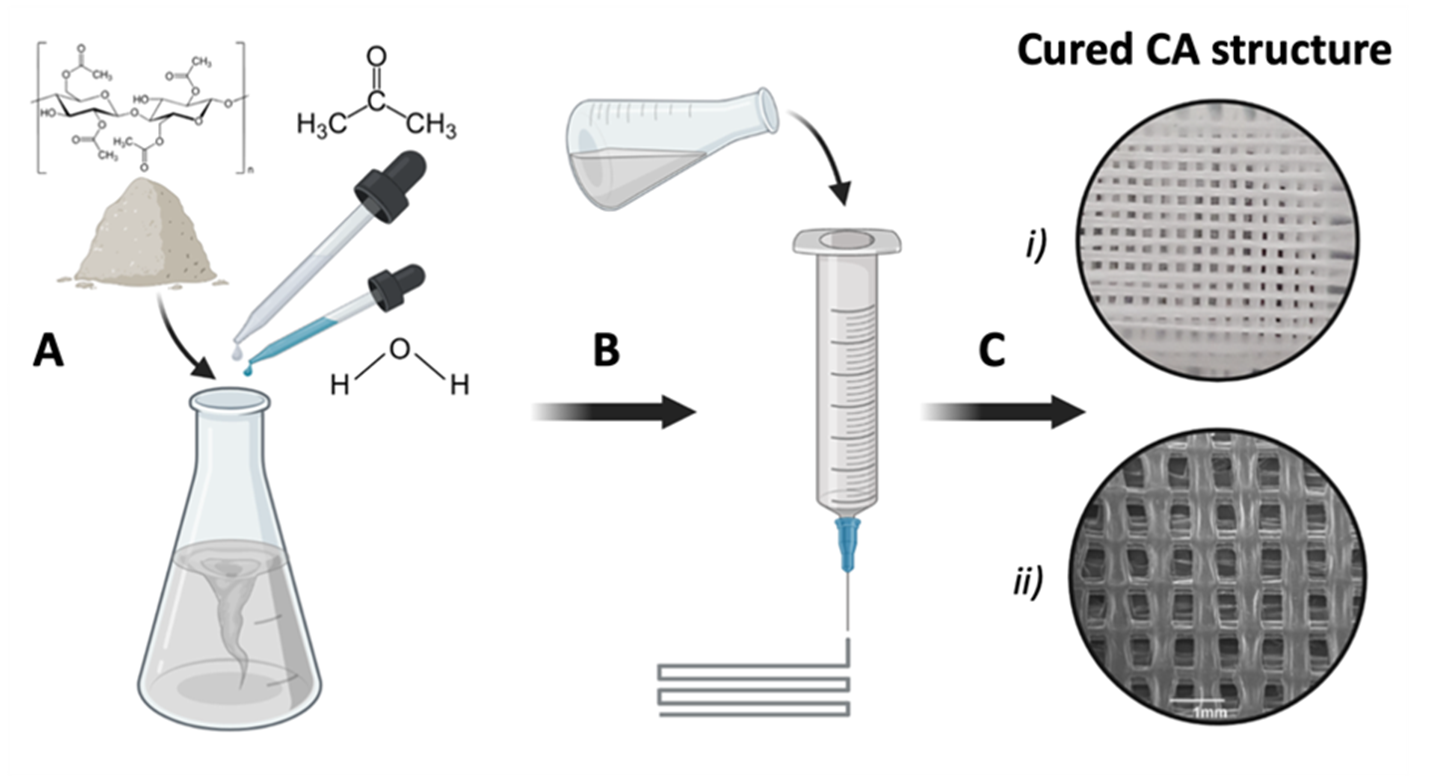
CA (number average molar mass, Mn ~30,000 g/mol; Sigma-Aldrich, United States of America [USA]) was selected as the bio-derived synthetic material for scaffold production, in combination with acetone (AC; ≥99.5%; Sigma-Aldrich, USA) and deionized water (di-H2O) to improve printability. CA bioinks (ranging from 20 to 30 wt%) were prepared in glass containers and stirred gently using magnetic stirrers at room temperature (~23°С) for 5–10 min, depending on the CA concentration.22 The CA bioinks were then allowed to rest for about 2–5 h (also concentration-dependent) until fully transparent and free of visible air bubbles. The same preparation method was applied for CA bioinks containing 10 wt% di-H2O, with the AC proportion adjusted accordingly.35
2.2. Poly(lactic acid) as the material for the production of the bioprinting head
Poly(lactic acid) (PrimaCreator™, Sweden) was selected as the material for 3D printing the components constituting the bioprinting head. PLA was selected due to its favorable mechanical properties, ease of printing, and environmentally sustainable nature.36 Known for its outstanding structural integrity, PLA ensures robustness and durability in the fabricated parts. Additionally, PLA’s renewable and biodegradable composition aligns with the growing emphasis on sustainability in modern engineering. Its use in this study not only ensures optimal performance but also reflects a commitment to environmentally responsible practices in the development of bioprinted structures.37
2.3. Basic 3D printer
An Ender 5 Pro (Creality, China) 3D printer was chosen as the base platform for conversion into a 3D bioprinter, due to its affordability, structural robustness, and build volume of 220 × 220 × 300 mm3.
2.4. Computer-aided design software
FUSION360™ (Autodesk®, USA) was chosen as the computer-aided design (CAD) software throughout the project. Its versatility supported the design of 3D models, simulation of assembly mechanisms, and verification of functional components. FUSION360™ was instrumental in the development of the 3D bioprinting head, the design of printability testing structures, and the generation of 3D scaffolds. By leveraging the capabilities of this software, the study ensured the accurate and efficient realization of complex designs while optimizing the overall functionality of the bioprinted components.38–40
2.5. Non-printed functional parts for the bioprinting head
The bioprinting head was designed to accommodate a 5 mL Injekt disposable syringe (B. Braun, Switzerland). Syringes of identical dimensions may also be used. A sterile blunt stainless-steel needle (22G; Cellink, Sweden) served as the bioprinting nozzle. For assembly, OEM M3 screw nuts (5×), M3 screws (9×), and an M5 lead screw (150 mm length, 2 mm pitch) were utilized. To improve calibration and alignment between parts and the printing surface, a 628-8 2RS ball bearing (SKF, Sweden) was used to align the driven gear with the M5 lead screw.
2.6. Slicing software
UltiMaker Cura (UltiMaker, the Netherlands) was employed to convert digital 3D models into printing instructions for the 3D printer. The slicing process consisted of following two phases: an initial phase using standard parameters for thermoplastics FDM 3D printing, followed by an optimization phase, where parameters were specifically adjusted for 3D bioprinting using fluid-DM. This two-phase approach ensured precise communication between the software and printer, facilitating the successful fabrication of the desired bioprinted structures.
2.7. Rheological instrumentation and measurement protocols
Two different approaches were utilized to assess the bulk viscoelastic properties of the CA bioinks. These methods aimed to minimize errors resulting from the rapid evaporation of AC and potential polymer migration at the solution–air interface, which could lead to the formation of a thin surface crust.41 To address this, a high value of the parameter K (defined as the ratio of sample volume to surface area at the air interface) was maintained. Specifically, a coaxial cylindrical Couette geometry and a custom-made cone-partitioned plate (CPP) geometry were used.42–45 The CPP geometry, specifically designed to mitigate edge fracture instabilities during high-rate shearing of viscoelastic samples, consists of a large-diameter rotating cone, a lower-diameter (inner) transducer-connected (measuring) plate, and an outer partition linked to a non-measuring bridge (further details are provided in Supplementary File). The sample overfills the geometry beyond the inner plate, allowing the excess material to contact the partition. Notably, any distortion of the outer surface does not affect shear stress measurements, provided it does not propagate to the inner plate. Recently, the CPP geometry has been acknowledged as an efficient means of conducting bulk measurements due to the negligible interfacial contribution from the partition.41 Building on this advantage, both CPP and cylindrical Couette geometries were employed in this study to evaluate the viscoelastic properties of the CA bioinks.
2.7.1. Measurements with cylindrical Couette geometry
A stainless-steel cylindrical Couette geometry was mounted on a Kinexus PRO (Malvern, UK) controlled-stress rheometer operating in controlled-strain mode. The outer cylinder (cup) had a diameter of 27.5 mm, while the inner cylinder (bob) had a diameter of 25 mm and a length of 37.5 mm. The bottom of the bob was shaped as a cone inclined at an angle of 15° and a height of 3.35 mm. When the geometry was filled to the top of the bob, the vertical distance from the bob’s top to the cup’s bottom measured 60 mm, resulting in a calculated K ratio of 13.3 mm.
To account for the submerged bob configurations, adjustments were made to include the bob’s new height and the driving shaft diameter (7.8 mm). It was ensured that evaporation at the larger free surface had minimal influence on the sample’s measurement surface (i.e., the bob). With an overfill height of 2 mm, the K ratio was calculated as 11.5 mm. These values align with similar experimental conditions reported in previous studies.41,46 Notably, the use of poly(dimethyl siloxane) viscosity standards (1 Pa·s at 25°С) revealed that a maximum overfill of 2.5 mm above the bob surface resulted in only a negligible impact on viscosity, with a mere 2% increase observed (see Figure S1, Supporting Information).
2.7.2. Measurements with cone-partitioned plate geometry
Two custom-made stainless steel CPP fixtures were employed. The first fixture featured an inner tool diameter of 10 mm, a partition diameter of 15 mm, and a gap size of 0.30 mm. It was mounted on a strain-controlled rheometer (ARES 2K FRTN1, TA Instruments, USA), equipped with a bottom cone of 25 mm diameter and a cone angle of 5.7°. The second fixture was specifically designed for weaker viscoelastic liquids. It featured an inner tool diameter of 25 mm, a partition diameter of 35.3 mm, and a smaller gap size of 0.15 mm. This configuration was mounted on a highly sensitive strain-controlled rheometer (ARES 100 FRTN1, TA Instruments, USA) and incorporated a bottom cone with a diameter of 52 mm and an angle of 2.1° (see Figure S2, Supporting Information).
2.7.3. Sample preparation and conditioning
Cellulose acetate bioinks ranging from 20 to 30 wt%, with and without di-H2O, were loaded onto the rheometer as quickly as possible. In all cases, a nearly saturated solvent environment was maintained using solvent-soaked tissues, and all airflow in the laboratory was eliminated by switching off ventilation systems. A constant temperature of 25°С was maintained throughout the experiments.
For the CPP geometry, temperature control was achieved via a Peltier element with an accuracy of ±0.1°С, which also served as the mounting base for the bottom cone. In contrast, Couette measurements were performed without active temperature control; the ambient temperature varied between approximately 20 and 24°С.
All rheological tests were conducted in steady shear mode. These measurements included transient tests— employing step changes in shear rate to monitor the evolution of the shear stress growth coefficient until a steady state was reached—and rate sweep tests, which compassed systematically ramping the shear rate up and down. In certain cases, the influence of evaporation was observed and is discussed further in the subsequent section. For each sample, three replicate measurements were performed to ensure data reproducibility.
2.8. Cell culture
Mesenchymal stem cells derived from the bone marrow of C57BL/6 mice were used as an experimental model to study cell adhesion, morphology, cytocompatibility, and mechanotransduction on the CA substrates. MSCs were cultured in cell culture flasks using Dulbecco’s modified Eagle’s medium—low glucose (1000 mg/L glucose) (Gibco™, USA), supplemented with 10% fetal bovine serum (Gibco™, USA) and 1% penicillin/streptomycin solution (Gibco™, USA). Cultures were maintained at 37°С in a humidified 5% CO2 incubator, with medium renewed every 3–4 days. MSCs used in the experiments were at passages 5–10. CA scaffolds were UV-sterilized and transferred into sterile wells of 24-well plates (Corning Incorporated, USA). Subsequently, 1×10⁵ cells/mL were seeded onto the scaffolds in culture medium and incubated for 2, 4, and 7 days. In all the experiments, tissue culture plastic (TCP) coverslips (polystyrene; Corning Incorporated, USA) were used as controls.
2.9. Scanning electron microscopic analysis of cells cultured on the scaffolds
The MSCs grown on CA scaffolds and TCP control samples were analyzed using the Jeol JSM – 639 OLV SEM (JEOL Ltd., Japan). Prior to SEM examination, samples underwent a standard fixation and dehydration protocol for biological specimens.
First, the culture medium was removed, and samples were washed twice with 0.1 M sodium cacodylate buffer (SCB; pH 7.4) (Sigma-Aldrich, USA) for 5 min at 4°С. Fixation was performed with a solution of 2.5% glutaraldehyde (Sigma-Aldrich, USA) and 2.5% paraformaldehyde (PFA; Sigma-Aldrich, USA) in SCB for 30 min at 4°С. The samples were then washed twice for 5 min each with 0.1 M SCB at 4°С.
For dehydration, samples were immersed in a graded ethanol (EtOH) series (30%, 50%, 70%, 90%, and 100%) (Sigma-Aldrich, USA) for 10 min at each concentration, all at 4°С. They were then treated twice with a 50:50 mixture of hexamethyldisilizane (HMDS) (Sigma-Aldrich, USA) and EtOH for 30 and 20 min, respectively, followed by two 20-min incubations in 100% HMDS at 4°С. As a final step, HMDS was removed, and the samples were allowed to dry completely overnight. Prior to SEM examination, samples were sputter-coated with a 15 nm gold film using a BAL-TEC SCD 050 sputter coater (BAL-TEC AG, Liechtenstein)
2.10. Immunocytochemical assay
For the immunocytochemical assay, the culture medium was removed, and samples were washed twice with 1× phosphate-buffered saline (PBS; pH 7.4) (Sigma-Aldrich, USA) for 5 min. Cells were then fixed with 4% PFA for 15 min at room temperature. After fixation, the PFA solution was removed, and samples were washed twice with 1× PBS. Cell membrane permeabilization was performed using 0.1% Triton X-100 (Sigma-Aldrich, USA) in PBS for 5 min. Samples were then washed twice again with 1× PBS for 5 min and blocked with 2% bovine serum albumin (BSA) (Sigma-Aldrich, USA) in PBS for 30 min.
Cells were subsequently incubated overnight at 4°С with the primary antibodies. For focal adhesion staining, a mouse anti-vinculin antibody (1:300 in PBS-BSA 1%; Millipore, USA) was used. The following day, samples were washed twice with 1× PBS and incubated for 2 h with the secondary antibody goat anti-mouse IgG 488 (1:300 in PBS-BSA 1%; Biotium, USA), and either CF® 568 phalloidin (1:800 in PBS-BSA 1%; Biotium, USA) or TRITC 532 phalloidin (1:1,000 in PBS-BSA 1%; Millipore, USA) for F-actin staining. Nuclear staining was performed using DAPI (4ʹ,6-diamidino-2-phenylindole; 1:1000 in PBS; Millipore, USA) at room temperature. The stained samples were mounted onto microscope slides for observation and imaged using a Leica SP8 laser inverted scanning confocal microscope (Leica Microsystems, Germany).
2.11. Image analysis
Image processing was performed using ImageJ (National Institute of Health, USA)47 and CellProfiler (Broad Institute, USA). CellProfiler was used to quantify cell morphological parameters, including cell area and the aspect ratios of both cells and nuclei. Custom image processing pipelines were created to load 2- or 3-channel immunofluorescence images for each analysis. Automated detection of cell nuclei and the extraction of morphological features were performed. To ensure consistency, the same processing parameters and algorithms were applied across all images.48–50
2.12. Statistical analysis
Statistical analysis was conducted using one-way ANOVA followed by post hoc Tukey’s HSD test for multiple comparisons between groups, using GraphPad Prism 8.0.2 (Dotmatics, United Kingdom). A p-value of less than 0.05 (p < 0.05) was considered statistically significant.
3. Results and discussion
3.1. Structural integrity analysis of the bioprinting head via computer-aided design
The 3D modeling and design of the bioprinting head were conducted using Autodesk’s FUSION 360, a CAD software that facilitates rapid design and provides tools for finite element analysis (FEA). This allowed for the application of specific stress conditions to the assembly, simulating a working environment and identifying weak spots for potential redesign (Figure 1).51,52

Figure 1. Schematic illustration of the custom-designed bioprinting head. (A) A 3D rendered view showcasing the overall configuration of the bioprinting system. (B) Finite element analysis of the symmetric design, showing stress concentration at the moving mounts (0.045 MPa) without deformation or strain under a 20 N applied force. The center of gravity is centrally aligned, ensuring balanced assembly. (C) Syringe-to-tip diameter reduction to calculate and optimize the feed rate during the printing process. (D) A commercially available filament exhibiting a smaller syringe-to-tip diameter reduction compared to (C). (E) For a 5 mL volume of bioink, 40 m of filament can be extruded through the needle tip.
The designed version (Figure 1A) utilized a 1:3 transmission ratio to convert vertical movement, optimizing system performance, and distributing working components evenly to ensure balanced weight distribution. Unlike conventional designs—such as those utilizing ITEM aluminum profiles, which concentrate mass toward the front of the holding structure—the presented design centers key components (e.g., positioning them atop the holding structure). This reduces cantilevered weight and minimizes torque, improving stability during X–Y axis movements. FEA results confirmed that this configuration effectively distributes mechanical loads from the weight and motion of the bioprinting head, yielding a maximum stress of 0.045 MPa (Figure S3B, Supporting Information), compared to 0.2 MPa in a front-mounted design (Figure S3A, Supporting Information). This prevents deformation or excessive stress. The result is a more stable and ergonomically integrated bioprinting head that minimizes mechanical strain and improves overall performance (Figure 1B).53
The bioprinting head was constructed exclusively from PLA parts, with an emphasis on compactness and reduced part count to save time and cost relative to other bioprinting heads.54,55 The conversion kit accommodates installation on different 3D printers by allowing adjustments to the alignment of the mounting plate holes. Standardized parts used in the assembly included M3 screw nuts (5×), M3 screws (9×), and a 150 mm M5 lead screw with a 2 mm pitch. While a ball bearing (e.g., 628-8 2RS SKF) can be used to improve alignment between the parts and the printing surface, it was not necessary in this case.56
3.2. Functional optimization of the bioprinter via hardware adaptation
3.2.1. Bioprinting extrusion system parameters
Adaptation of a standard 3D printer for bioprinting necessitated recalibrating the extrusion system to accommodate a 5 mL syringe. Similar to FDM printing— where a filament is reduced in diameter at the nozzle— this system extrudes material from a syringe with a 14.57 mm inner diameter through a 22-gauge nozzle (0.41 mm inner diameter). Firmware modifications enabled extrusion at room temperature (23 °C), addressing the lower temperature requirements of bioprinting compared to traditional FDM. Optimization of the extrusion stepper motor involved adjusting the eSteps/mm parameter. The printer’s default setting of 93 eSteps/mm—calibrated for 1.75 mm filament and a 0.4 mm nozzle—was recalculated to 4800 eSteps/mm to suit the syringe-based system. This calculation accounted for the stepper motor’s 200 steps/ revolution, 1:16 microstepping, a 1:3 gear ratio, and a 2 mm lead screw pitch. This configuration ensures precise, low-rate extrusion for every 1.25 mm of printed material, 0.001 mm is deposited vertically within the syringe, corresponding to 4.1 eSteps for smooth movement. At 50% stepper motor power, the time required for complete syringe unloading was determined to be 115 s (Table 1).
Table 1. Extrusion system parameters and calculations
| Parameter | Value | Unit | Calculation/Reason |
|---|---|---|---|
| Syringe inner diameter | 14.57 | mm | Datasheet |
| Syringe inner area | 166.6 | mm² | π × (14.57/2)² |
| Nozzle inner diameter | 0.41 | mm | Datasheet |
| Nozzle inner area | 0.132 | mm² | π × (0.41/2)² |
| Printed width (W) | 0.40 | mm | Measured |
| Printed height (H) | 0.40 | mm | Measured |
| Vertical deposition per ~1.25 mm printed | 0.001 | mm | (166.6×0.001)/0.132 |
| eSteps per 1 mm printed | 4.1 | eSteps | |
| Stepper motor steps/revolution | 200 | eSteps | |
| Microstepping | 1:16 | ||
| Gear ratio | 1:3 | ||
| Lead screw pitch | 2 | mm | |
| Calculated eSteps/mm | 4800 | eSteps/mm | (200×16×3)/2 |
| Deposition time (50% performance) | 115 | s |
3.2.2. Rapid modeling and slicing procedure
A simplified cubic scaffold model was designed using basic extrusion commands in CAD software to reduce computational load. The resulting STL file was scaled to the desired dimensions using slicing software (see Figure S4, Supporting Information). Scaffold architecture was optimized by adjusting the infill line distance (rod-to-rod spacing) to 0.7 mm. With a printed line width of 0.35–0.4 mm—accounting for material stretching during vertical printing and movement speed—this configuration resulted in a pore size of approximately 300 μm (Figure 1C and D). Pore size is influenced by nozzle gauge, print speed, and the solidification rate of the material, which in turn depends on the material composition and solvent evaporation rate (discussed further in subsequent sections). A line infill pattern with alternating 0° and 90° layer orientation was employed. Finally, the extrusion rate was optimized either by adjusting the slicer’s filament diameter setting to match the syringe’s 14.57 mm inner diameter or by reducing the feed rate to 8–11% to compensate for the difference between syringe and standard filament diameters.57
3.3. Rheological characterization of cellulose acetate bioinks
The rheological analysis includes steady-state shear viscosity measurements as a function of shear rate for different CA samples, assessing using both CPP and Couette geometries. In particular, Figure 2 depicts the steady shear viscosity profiles for four formulations: two CA concentrations (20 wt% [Figure 2A] and 28 wt% [Figure 2B]) in two solvents—AC and a mixed solvent of di-H2O and ΑC. Viscosity measurements exhibited minimal variation across different experimental conditions, including batch differences, loadings, and geometries.

Figure 2. Rheological characterization of cellulose acetate (CA) solutions. (A) Steady-state shear viscosity as a function of shear rate for 20% CA/acetone (AC) and 20% CA/AC/di-H2O in both cone-partitioned plate (CPP) and Couette geometries. (B) Same comparison for 28% CA/AC and 28% CA/AC/di-H2O in both CPP and Couette geometries. (C) Overall comparison of steady-state shear viscosity values for all CA concentrations based on Couette data. (D) Zero-shear (steady) viscosity as a function of CA concentration, averaged across different geometries and batches. Fitted lines are shown (see text).
Notably, solutions containing 28 wt% CA exhibited greater stability over time, as indicated by smaller discrepancies among repeated measurements. The viscosity profiles displayed Newtonian behavior at low shear rates, with mild shear thinning observed at higher shear rates— particularly in the higher concentration sample. Figure 2C illustrates the evolution of shear thinning with increasing CA concentration (data obtained using Couette geometry).
The shear-rate-dependent viscosities of the different solutions were fitted using an empirical expression (represented by lines in the figure)58:
where η0 and η∞ are the zero-shear and high-shear limiting viscosities, respectively; τc is the characteristic time for the onset of shear thinning; and α is the shear thinning exponent. At the lowest concentration, the viscosity remained nearly constant (Newtonian) across the examined shear rate range (with a low exponent of 0.19), indicating Newtonian behavior. As concentration increased, both the viscosity and degree of shear thinning rose, as reflected by increasing values of η0, α, and τc. The strongest shear thinning was observed at the highest concentration (30 wt%), with exponents of 0.35 and 1.09 for the AC/di-H2O and AC solvents, respectively. Further details are provided in Table S1, Supporting Information.
Importantly, the viscosity values align well with those reported in the literature for similar systems, confirming the consistency of these findings.58
The average zero-shear viscosities (obtained from measurements using both the Couette and CPP geometries, as shown in Figure 2A and B) are plotted against concentration in Figure 2D. The data were fitted using the empirical relationship:
where A and n are fit parameters (represented by lines in the figure). For CA/AC and CA/AC/di-H2O, the values of A and n are 5.6 × 10⁻⁵ and 0.51, and 5 × 10⁻³ and 0.36, respectively. As expected, the viscosity increases proportionally with CA concentration. In all cases, CA solutions in AC exhibited slightly higher viscosity values compared to those in the AC/di-H2O mixture. While there is some uncertainty in the data for the 30 wt% solution, the overall trend remains consistent. However, at this specific concentration, the possibility of microstructural changes cannot be disregarded. The solubility of CA in a given solvent relies heavily on intra- and inter-molecular interactions arising from the functional groups within the CA chains, as well as the polarity of the solvent.59,60 Variations in solvent quality, CA concentration, and molecular characteristics (such as molar mass and polydispersity) can result in diverse chain conformations and network microstructures, including cluster formation and phase separation.61,62 Unlike the stable behavior observed in solutions utilizing the mixed solvent over extended periods, concentrated solutions in AC (30 and 60 wt%) exhibited visible signs of phase separation. Furthermore, sheared solutions in the mixed solvent appeared opaque, suggesting that flow-induced microstructural or phase changes may be occurring—an observation that warrants further investigation.
Notably, the viscosity exhibited an approximately eightfold increase from 25 to 30 wt%, which is significantly greater than typically observed in polymer solutions. This sharp rise likely signifies the formation of large-scale molecular arrangements and/or clusters, independent of solvent evaporation.
The efficiency and quality of 3D printing processes depend largely on the rheology of the printed material. The shear thinning behavior of these highly viscous solutions is important for efficient processing, as the 3D printer relies on capillary flow through a nozzle during extrusion.
In general, the material must exhibit shear thinning to facilitate flow, while also avoiding instabilities—such as stick-slip behavior—that can lead to extrudate distortion. Additionally, the deposited extrudate should self-heal and/or solidify to yield the desired final product. In this context, the design of the injection capillary, needle, and nozzle plays a crucial role. This requires a detailed analysis of the flow behavior of the specific viscoelastic fluid through the geometry of interest. While the comprehensive study of viscoelastic flow in such configurations is the subject of separate investigations, here we account for the basic rheological features that affect the printing process.4,21,47,63–66 In particular, we combined experimental and literature evidence to develop a promising capillary-needle-nozzle design, although no further optimization was pursued. Using this setup, the high-viscosity CA solutions were adjusted to shear thin within the range of shear rates relevant to the printing process. This represents an important and direct link between bioprinting and the rheological behavior of the material, demonstrating the effectiveness of the process and offering promise for further developments.
A naïve estimate of the relevant apparent shear rate to this bioprinting application—based on a printing speed of 3 mm/s and a nozzle tip radius of 0.2 mm—yields a value of 15 s–1. This value is well within the shear thinning regime of the printed solutions (see Figure 2); that is, the viscosity is evidently reduced with respect to its equilibrium (zero-shear) value, thereby facilitating extrusion. It should be noted that this discussion, which links printing efficiency to the rheological properties presented in Figure 2, refers to the bulk rheological properties of the CA solutions in the absence of evaporation (within the limits of experimental capabilities). Therefore, it relates to the material’s performance of the CA solution inside the capillary, before it exits into the atmosphere through the nozzle. Upon exiting, rapid evaporation of the AC solvent takes place. Although not examined in detail in this work, this aspect is relevant to the formation and deposition of the final printed product. While minimizing the impact of evaporation and preventing the formation of a surface “skin” at the solution–air interface is often considered important,67 this instantaneous solidification at the filament edge can, in fact, stabilize the structure and assist the bioprinting process. It is expected that AC evaporation begins almost immediately—on the order of milliseconds—resulting in the formation of a polymer skin layer on the filament surface, which then undergoes shrinkage.68 This shrinking process continues, albeit at a slower rate, due to the extended time required for solvent diffusion through the skin layer.68 Further consequences of this evaporation-driven behavior are discussed in the following sections.
3.4. Printability limitations analysis of cellulose acetate bioinks
Generally, the main printability limitations are related to the intrinsic properties of the bioink material, such as printing speed, feed rate, viscosity, and—specifically in the case of CA—the evaporation of AC.29,69 As previously mentioned in Section 2.1, CA combined with AC forms a solution that is easy to optimize and capable of rapidly forming structures due to AC’s high volatility, which promotes evaporation driven by pressure and diameter differentials. However, despite these advantages, several challenges had to be addressed to ensure optimal printability. One major limitation was related to CA concentration. When the concentration exceeded 30%, the mixture became too viscous to transfer from the vial to the syringe.70
3.4.1. Printability enhancement via deionized water addition
A significant challenge encountered during bioprinting was the rapid solidification of the CA bioink at the nozzle tip during travel moves. This issue, previously addressed in the literature,68 is attributed to the exposure of the bioink to the air between deposition steps. Such exposure led to nozzle clogging, inconsistent feed rates, and material pooling. Initially, manual cleaning was required to remove the solidified material (Figure 3C). To automate this process and ensure consistent printing, the g-code was modified to include nozzle cleaning paths. However, this solution increased the overall printing time.

Figure 3. Parameters and affecting 3D bioprinting of cellulose acetate (CA) bioinks. (A) Speed profile analysis showing 3 mm/s as the optimal printing speed for morphological stability. (B) Optical images of printed lines with speeds ranging from 2 to 7 mm/s (left to right). Scale bar: 2 mm; magnification: 10×. (C) Solutions lacking H2O exhibited poor printability, with asymmetric line morphology due to the bioink failing to detach from the needle tip. Scale bar: 1 mm; magnification: 20×. (D) Solutions containing H2O demonstrated improved printability, forming uniform lines without user intervention. Scale bar: 1 mm; magnification: 18×. (E) Fused deposition modeling thermoplastics maintained their shape over time. (F) Evaporation of acetone from CA bioinks caused filament shrinkage, affecting final geometry.
To further address these issues and improve printability, di-H2O was added to the bioink solution at a concentration of 10 wt% (Figure 3D).71 This modification reduced the evaporation rate and eliminated the need for manual intervention, thereby enabling autonomous printing. Furthermore, the inclusion of di-H2O allowed for a wider range of printing speeds (2–7 mm/s) while maintaining symmetrical deposition and print repeatability comparable to PLA.72,73
3.4.2. Printing speed optimization
As previously noted, a 22-gauge nozzle (0.41 mm inner diameter) was used for the optimization of the 3D bioprinter and associated printing parameters. To determine the optimal printing speed for achieving a consistent line width of 0.35–0.4 mm—comparable to that of an FDM 3D printer—a parametric speed profile ranging from 2 to 7 mm/s was evaluated (Figure 3A). SEM imaging of the resulting printed lines revealed that a printing speed of 3 mm/s yielded the desired line width, as illustrated in Figure 3B.66,74,75
3.4.3. Evaluation of solvent evaporation as a dual printability factor
Solidification of the bioink occurs through the evaporation of AC from the solution into the atmosphere. As previously mentioned, this process starts immediately upon extrusion and contributes to maintaining a stable filament that can be readily deposited onto the substrate. However, over time, AC continues to evaporate, and eventually, the process completes, resulting in a shrunken 3D model structure (Figure 3F). This behavior contrasts with the FDM process, in which the fused material retains its mass and volume after solidification (Figure 3E).
In this context, the continuous (albeit progressively slowed) evaporation introduces a limitation: the final layer height becomes dependent on the initial CA concentration. For example, a 20 wt% CA solution would yield a final layer thickness that is approximately 20% of the initially deposited height. Thus, a 0.4-mm-deposited layer would result in a final layer height of 0.08 mm after complete evaporation.76 This estimation assumes full evaporation of AC and neglects the exponentially slowed rate of evaporation that becomes critical at later stages due to the formation of a thickened skin layer. Typically, the radius R of a filament composed of an evaporating polymer solution shrinks as R~exp(-t/τ), where τ represents the solvent diffusion time through the glassy or crystalline skin layer.68
3.4.4. Quantification of shrinkage along the X–Y–Z axes
Scaffold samples were printed in triplicate and analyzed via SEM at 1, 3, and 24 h post-printing (Figure 4A–C). Measurements (Figure 4D) revealed a rapid 6–7% reduction in layer height within the first few hours, which slowed to 5–6% between 3 and 24 h at room temperature, consistent with the decelerated evaporation discussed above. The extruded volume prior to shrinkage was approximately 0.05 mm³. The final structure is determined by CA molecular interactions after evaporation of both AC and di-H2O.

Figure 4. Structural shrinkage analysis of printed cellulose acetate (CA) scaffolds along the X–Y–Z axes over time, caused by evaporation of acetone and di-H2O from the bioink. (A–C) Sectional view of 28 wt% CA scaffolds (eight layers) at (A) 1 (scale bar: 500 μm; magnification: 35×), (B) 3 (scale bar: 500 μm; magnification: 35×), and (C) 24 h post-printing (scale bar: 500 μm; magnification: 35×), illustrating time-dependent shrinkage. (D) Quantitative analysis revealed shrinkage of 6–7% within the first 3 h, 5–6% between 3 and 24 h, and total shrinkage of 13%, significantly lower than the theoretical 72%. (E–G) Scanning electron microscopic (SEM) top-view images (scale bar: 2 mm; magnification: 10×) of 3D, 10-layered, 10 × 10 × 3 mm3 scaffolds at (E) 1 (scale bar: 2 mm; magnification: 10×), (F) 3 (scale bar: 2 mm; magnification: 10×), and (G) 24 h (scale bar: 2 mm; magnification: 10×) post-printing. (H) X–Y axis shrinkage analysis based on comparisons between the computer-aided design (CAD) model and the printed scaffolds at 1, 3, and 24 h. Mean X–Y dimensions indicated immediate shrinkage upon printing, while differences in resolution were primarily attributed to printability factors. (I, J) High-magnification SEM top-view images (scale bar: 500 μm; magnification: 50×) of 3D, 10-layered, 10 × 10 × 3 mm3 scaffolds at (I) 1 h (scale bar: 500 μm; magnification: 50×) and (J) 24 h (scale bar: 500 μm; magnification: 50×) post-printing. (K) Analysis of the shrinkage effect on hole resolution, comparing the CAD model with scaffolds at 1 and 24 h. Mean hole dimensions showed an 8% variation, attributed to printability rather than shrinkage (negligible impact). (L) Analysis of the shrinkage effect on printed lines, comparing the CAD model with 1-, 3-, and 24-h post-printed scaffolds. A 3% variation was observed, primarily due to printability parameters (e.g., printing speed and layer height), while the shrinkage effects were minor at this stage.
Shrinkage along the X–Y axis was evaluated using similarly prepared samples (Figure 4E–G) at the same time points, yielding a shrinkage value of 10% (Figure 4H). The initial rapid shrinkage followed by negligible dimensional change over time reflects the progressive evaporation of solvents, which becomes less critical as time elapses. Additionally, the observed shrinkage may be partly due to the suboptimal printability of the CA bioink.77
3.4.5. Shrinkage analysis of fabricated pores
Analysis of the scaffold’s internal pore resolution (Figure 4I and J) revealed an 8% difference between the designed and measured pore dimensions (Figure 4K). This discrepancy is attributed to printing limitations, such as material shrinkage and potential inconsistencies in deposition. However, line width measurements revealed only a 3% deviation from the intended dimensions (Figure 4L), indicating minimal shrinkage. These results confirm the system’s high-resolution printing capability when used with the CA-based bioink.78
3.5. Printing resolution and optimization of cellulose acetate scaffolds
Scaffold resolution was assessed via SEM imaging of single- and multi-layered extruded lines (Figure 5A–C), revealing excellent printability of the CA-AC/di-H2O bioinks, comparable to that of FDM-printed thermoplastics. A 28 wt% CA bioink provided optimal results, offering a balance between structural integrity, symmetrical line, and pore formation (Figure 5B), making it suitable for physical testing and immersion in aqueous solutions (see Figure S5, Supporting Information). While the 30 wt% CA bioink yielded superior symmetry (Figure 5C), rapid solvent evaporation compromised interlayer adhesion (Figure S5, Supporting Information).79,80

Figure 5. Comparison of average line widths in 20-layer scaffolds. (A) 20 wt% cellulose acetate (CA) produced line 500 μm in width. Scale bar: 1 mm; magnification: 12×. (B) 28 wt% CA produced lines 400 μm in width, matching the needle tip diameter—considered optimal. Scale bar: 1 mm; magnification: 13×. (C) 30 wt% CA yielded slightly narrower lines (width: 380 μm). Scale bar: 1 mm; magnification: 12×. (D) 28 CA wt% was identified as the ideal concentration, as 30 wt% showed poor interlayer adhesion.
Table 2 compares the resolution quality and printability of the various scaffolds. The addition of di-H2O to CA solutions proved crucial for enhancing printability. CA solutions (20–28 wt%) without di-H2O resulted in asymmetrical structures, whereas those containing di-H2O (20–30 wt%) exhibited improved printability and symmetry. Ultimately, the 28 wt% CA solution with di-H2O (CA28) was selected for cell culture studies due to its optimal combination of symmetry, strong interlayer adhesion, and overall functionality (Figures 5B).81
Table 2. Optimization of scaffold quality based on composition and printing parameters
| CA wt% | di-H2O % | Printability | Required resolution (slicer; μm) | Produced resolution (μm) | Shrinkage (X–Y axis) (%) | Layer adhesion | Quality (1–10) |
|---|---|---|---|---|---|---|---|
| 20 | Yes | Mid | 400 | 200 | 25 | Yes | 5 |
| 20 | No | Low | 400 | - | - | Yes | 1 |
| 25 | Yes | High | 400 | 300 | 15 | Yes | 5 |
| 25 | No | Mid | 400 | - | - | Yes | 1 |
| 28a | Yesa | Higha | 400a | 400a | 13a | Yesb | 10b |
| 28 | No | Low | 400 | - | - | Yes | 1 |
| 30 | Yes | High | 400 | 400 | 9 | Noc | 6c |
| 30 | No | Low | 400 | - | - | No | 1 |
Notes: This table highlights the critical relationship between scaffold composition and printing parameters, particularly the presence of deionized water (di-H₂O), in achieving optimal scaffold functionality. Scaffold quality was evaluated on a scale of 1–10 based on resolution and printability, under a constant printing speed of 3 mm/s. Abbreviations: CA, cellulose acetate; di-H2O, deionized water.
aCritical optimization characteristics.
bOptimal fabrication results.
cDefective fabrication results.
3.6. Preliminary cell studies of cellulose acetate scaffolds for cell adhesion and proliferation
As presented in Section 2.8, MSCs were used as an in vitro model for preliminary cell studies. To explore the effects of the 3D-printed CA28 scaffolds on MSC behavior, cells were cultured on the scaffolds for 2, 4, and 7 days.
This analysis aimed to investigate whether MSC volume correlates with the structural and rheological characteristics of the CA scaffolds and how these factors affect cell spreading, morphology, and shape. As shown in Figure 6A and B, MSCs adhered to the scaffolds within the first 2 days, primarily occupying the convex printed lines on the top surface. They exhibited film-like spreading behavior, with early indications of migration toward the scaffold’s inner layers. This migratory phenomenon became more pronounced after 4 days. By this time, the cell layer extensively covered the top surface, displaying numerous lamellipodia, indicative of strong adhesion, and several cells had extended across neighboring printed lines (Figure 6C and D). After 7 days, MSCs had infiltrated the inner layers of the scaffold and displayed clear signs of adhesion through cellular extensions. Proliferation occurred in all directions along both the top and side surfaces of the printed lines. At the top surface, cells tended to cover scaffold pores (Figure 6E and F). It is worth mentioning that no coating techniques—such as poly-L-lysine or ECM proteins (e.g., laminin)—were used prior to seeding, emphasizing the strong cell-adhesive properties of the CA scaffolds.

Figure 6. Scanning electron microscopic images of mesenchymal stem cells cultured on printed 28 wt% cellulose acetate (CA) (CA28) scaffolds. (A, B) After 2 days (tilted view; [A]: scale bar: 100 μm, magnification: 100×; [B] scale bar: 20 μm, magnification: 750×). (C, D) After 4 days (tilted view; [C]: scale bar: 100 μm, magnification: 100×; [D] scale bar: 20 μm, magnification: 750×). (E, F) After 7 days (tilted view; [E]: scale bar: 100 μm, magnification: 100×; [F] scale bar: 100 μm, magnification: 250×). Yellow boxes in (C) and (D) highlight concave and convex surface regions, respectively.
The 3D-printed CA28 scaffolds provided a symmetric, non-polarized microenvironment for MSCs. Geometrical parameters—e.g., height and surface area of the printed lines and pore size—were consistent throughout. Scaffold stiffness was influenced by CA concentration, solvent composition, and the specific printing method. Flattened cells, observed at all time points, exhibited distinct volumetric differences compared to rounded cells, which were only present at the 2-day time point.
Mesenchymal stem cells cultured on all samples were successfully stained with vinculin (green) and actin/ cytoskeleton (red) on Days 2 (Figure 7A and B) and 4 (Figure 7C and D). SEM and confocal imaging revealed similar spreading patterns on the CA28 scaffolds at both time points, with cells adhering and spreading from the top surface into the inner scaffold layers. Vinculin-containing focal adhesion points were more pronounced and localized, especially in the perinuclear region of the cells (Figure 7A and B) on Day 2, although these appeared immature and diffusely distributed (poorly visible).

Figure 7. Fluorescence and scanning electron microscopic (SEM) analysis of mesenchymal stem cells (MSCs) on printed 28 wt% cellulose acetate (CA) (CA28) scaffolds. (A–D) Fluorescence images at 2 (A, B) and 4 (C, D) days. Cytoskeleton stained red (TRITC-532 phalloidin), focal adhesions green (anti-vinculin antibody, Alexa Fluor 488), and nuclei blue (DAPI). Scale bar: 100 μm, magnification: 20×. (E, F) SEM top-view images of printed CA28 scaffolds. Scale bar: (E) 500 μm and (F) 100 μm, magnification: (E) 40× and (F) 100×. Yellow boxes indicate the printed lines and pores of the scaffolds. (G–J) Morphological analysis of MSCs cultured on the printed CA28 scaffolds. (G, H) Cell area (in μm2) represented as relative frequency (%) at (G) 2 days and (H) 4 days (n = 50). (I) Cell aspect ratio (ratio of long to short cytoskeleton axis), analyzed separately for cells located on pores and printed lines at each time point (n = 50–100). (J) Nuclear aspect ratio (ratio of long to short nuclear axis), also analyzed by location (pores vs. printed lines) at each time point (n = 50–100). Data were analyzed using one-way ANOVA followed by Tukey’s HSD post hoc test for multiple group comparisons. (Notes: *p < 0.05, **p < 0.001, ***p < 0.0001).
By Day 4, more matured focal adhesions were observed, especially along the cytoskeletal edges, while some vinculin remained diffusely localized in the perinuclear area (Figure 7C and D). The cytoskeleton displayed both parallel (short and long) actin fibers and spot-like actin structures, reflecting variations in MSC morphology and degree of spreading. On Day 4, the actin cytoskeleton was more organized, with fibers concentrated at the cell edges, indicating increased spreading and migration from the top surface to the inner layers of the printed scaffolds.
Interestingly, in regions where parallel actin fibers were clearly observed, vinculin staining was less pronounced. This suggests that cells shape, morphology, and intercellular connectivity—whether on top or side surfaces—are influenced by the printing process itself. Specifically, the shear-thinning behavior of the CA solution may affect the final scaffold architecture, which in turn governs actin fiber orientation.
Immunofluorescence image analysis revealed that after 4 days of culture, the cell area increased, which correlated with a reduction in both cell and nuclear aspect ratio (Figure 7G–J). Similar observations have been reported by others, showing that larger cell areas are typically associated with smaller cell and nuclear aspect ratios.82 The observed decrease in aspect ratios after 4 days of culture indicates morphological changes, with both the cells and their nuclei appearing more flattened. It has been previously reported that nuclear shape can alter in response to overall cell morphology.83,84
Interestingly, higher cell and nuclear aspect ratios were observed in the pore regions, indicating active cell migration into the inner layers of the scaffold. Furthermore, the nuclear aspect ratio varied from nearly round in flat cells located on the printed lines, to more elongated and anisotropically oriented shapes in cells residing within the concave pore regions. Such nuclear shape changes are closely associated with various cellular functions, including proliferation in both physiological and pathological contexts.85
Based on vinculin staining, cell attachment appeared stronger after 4 days of culture, and active migration into the scaffolds was apparent (Figure 7C and D). Notably, the cells demonstrated distinct adhesion patterns depending on the curvature of the scaffold (Figure 6C and D). On convex surfaces—such as the top of the printed lines— MSCs maintained full contact with the substrate. On the contrary, on concave surfaces—typically located at the interface between the top and inner scaffold layers, or where curvature altered—cells displayed partial detachment of their central body from the substrate, while their peripheral filopodia extensions remained anchored.
It is important to note that the scaffold curvature of the printed lines may vary depending on fabrication parameters such as layer height and printing speed. These findings corroborate those of Werner et al.,86 who described cell attachment at convex surfaces as “snail-like” and on concave surfaces as “spider-like.” Both Werner et al.86 and Bidan et al.87 reported that concave surfaces facilitate cell migration, as cellular extensions can move more freely and rapidly through dynamic remodeling of adhesion points Кάντε κλικ ή πατήστε εδώ για να εισαγάγετε κείμενο. Moreover, it has been shown that convex surfaces enhance osteogenic differentiation of MSCs.86,88 Therefore, the printed CA28 scaffolds presented in the current study show significant promise for applications in bone tissue engineering.
4. Conclusion
In this study, we successfully converted a standard 3D printer into a high-precision 3D bioprinter, primarily composed of 3D-printed parts, capable of fabricating high-resolution scaffolds (300 μm) comparable to those produced using traditional thermoplastic materials and FDM techniques. A novel printing protocol was developed through systematic experimentation and iterative optimization of printing parameters. Rheological characterization and SEM morphological evaluation identified the optimal bioink composition of 28 wt% CA, 62 wt% AC, and 10 wt% di-H2O (CA28), which exhibited suitable properties for high-resolution bioprinting. Precise control of printing speed was crucial, as higher speeds compromised resolution and structural detail, leading to an optimal printing speed of 3 mm/s.
While the 3D-printed scaffolds exhibited slight anisotropic shrinkage (13% on the Z-axis and 10% on the X–Y axis), the overall pore resolution remained unaffected. In vitro studies with MSCs demonstrated excellent cell adhesion and proliferation on the CA scaffolds. MSCs formed a film-like coverage on the top surface and migrated toward the inner layers, exhibiting lamellipodia extension and strong adhesion. Morphological analysis revealed the presence of parallel actin/cytoskeleton fibers and a shift toward more flattened cells after 4 days of culture. Increased cell area and reduced cell and nuclear aspect ratios on the CA printed lines indicated cell remodeling and potential functional changes.
These findings demonstrate the potential of the converted system for high-viscosity, high-resolution bioprinting, and highlight CA as a promising biomaterial for scaffold fabrication. The observed cell–material interactions provide valuable insights into biomaterial design and contribute to our understanding of how scaffold composition influences cell behavior, advancing the fields of tissue engineering and regenerative medicine.
1.Shafiee A, Atala A. Tissue engineering: toward a new era of medicine. Annu Rev Med. 2017;68:29-40.
doi: 10.1146/annurev-med-102715-092331
2.Cai S, Wu C, Yang W, Liang W, Yu H, Liu L. Recent advance in surface modification for regulating cell adhesion and behaviors. Nanotechnol Rev. 2020;9(1):971-989.
3.Valino AD, Dizon JRC, Espera AH, Chen Q, Messman J, Advincula RC. Advances in 3D printing of thermoplastic polymer composites and nanocomposites. Prog Polym Sci. 2019;98:101162.
doi: 10.1016/j.progpolymsci.2019.101162
4.Decante G, Costa JB, Silva-Correia J, Collins MN, Reis RL, Oliveira JM. Engineering bioinks for 3D bioprinting. Biofabrication. 2021;13:032001
5.Picard M, Mohanty AK, Misra M. Recent advances in additive manufacturing of engineering thermoplastics: challenges and opportunities. RSC Adv. 2020;10:36058-36089.
doi: 10.1039/d0ra04857g
6.Khoshnevisan K, Maleki H, Samadian H, et al. Cellulose acetate electrospun nanofibers for drug delivery systems: applications and recent advances. Carbohydr Polym. 2018;198:131-141.
doi: 10.1016/j.carbpol.2018.06.072
7.Zuppolini S, Salama A, Cruz-Maya I, Guarino V, Borriello A. Cellulose amphiphilic materials: chemistry, process and applications. Pharmaceutics. 2022;14(2):386.
doi: 10.3390/pharmaceutics14020386
8.Courtenay JC, Deneke C, Lanzoni EM, et al. Modulating cell response on cellulose surfaces; tunable attachment and scaffold mechanics. Cellulose. 2018;25(2):925-940
doi: 10.1007/S10570-017-1612-3/FIGURES/6
9.Sofi HS, Akram T, Shabir N, Vasita R, Jadhav AH, Sheikh FA. Regenerated cellulose nanofibers from cellulose acetate: incorporating hydroxyapatite (HAp) and silver (Ag) nanoparticles (NPs), as a scaffold for tissue engineering applications. Mater Sci Eng C. 2021;118:111547.
doi: 10.1016/J.MSEC.2020.111547
10.Chen C, Xi Y, Weng Y. Recent advances in cellulose-based hydrogels for tissue engineering applications. Polymers (Basel). 2022;14(16):3335.
11.Tudoroiu EE, Dinu-Pîrvu CE, Albu Kaya MG, et al. An overview of cellulose derivatives-based dressings for wound-healing management. Pharmaceuticals (Basel). 2021;14(12):1215.
doi: 10.3390/ph14121215
12.Fooladi S, Nematollahi MH, Rabiee N, Iravani S. Bacterial cellulose-based materials: a perspective on cardiovascular tissue engineering applications. ACS Biomater Sci Eng. 2023;9(6):2949-2969.
doi: 10.1021/acsbiomaterials.3c00300
13.Janmohammadi M, Nazemi Z, Salehi AOM, et al. Cellulose-based composite scaffolds for bone tissue engineering and localized drug delivery. Bioact Mater. 2022;20:137-163.
doi: 10.1016/j.bioactmat.2022.05.018
14.Golizadeh M, Karimi A, Gandomi-Ravandi S, et al. Evaluation of cellular attachment and proliferation on different surface charged functional cellulose electrospun nanofibers. Carbohydr Polym. 2019;207:796-805.
doi: 10.1016/j.carbpol.2018.12.028
15.Gouma P, Xue R, Goldbeck C, et al. Nano-hydroxyapatite— cellulose acetate composites for growing of bone cells. Mater Sci Eng C. 2012;32(3):607-612.
doi: 10.1016/j.msec.2011.12.019
16.de Oliveira Neto GC, Teixeira MM, Souza GLV, et al. Assessment of the eco-efficiency of the circular economy in the recovery of cellulose from the shredding of textile waste, Polymers. 2022;14:1317.
17.Jing L, Shi T, Chang Y, et al. Cellulose-based materials in environmental protection: a scientometric and visual analysis review. Sci Total Environ. 2024;929:172576.
doi: 10.1016/j.scitotenv.2024.172576
18.Wang Q, Sun J, Yao Q, Ji C, Liu J, Zhu Q. 3D Printing With Cellulose Materials. Netherlands: Springer; 2018.
doi: 10.1007/s10570-018-1888-y
19.Rosso F, Marino G, Giordano A, Barbarisi M, Parmeggiani D, Barbarisi A. Smart materials as scaffolds for tissue engineering. J Cell Physiol. 2005;203(3):465-470.
doi: 10.1002/jcp.20270
20.Özkale B, Sakar MS, Mooney DJ. Active biomaterials for mechanobiology. Biomaterials. 2021;267:120497.
doi: 10.1016/j.biomaterials.2020.120497
21.Kim BS, Park IK, Hoshiba T, et al. Design of artificial extracellular matrices for tissue engineering. Prog Polym Sci. 2011;36(2):238-268
doi: 10.1016/J.PROGPOLYMSCI.2010.10.001
22.Huang H, Dean D. 3-D printed porous cellulose acetate tissue scaffolds for additive manufacturing. Addit Manuf. 2020;31:100927.
doi: 10.1016/j.addma.2019.100927
23.Papadimitriou L, Manganas P, Ranella A, Stratakis E. Biofabrication for neural tissue engineering applications. Mater Today Bio. 2020;6:100043.
doi: 10.1016/J.MTBIO.2020.100043
24.Grashoff C, Hoffman BD, Brenner MD, et al. Measuring mechanical tension across vinculin reveals regulation of focal adhesion dynamics. Nature. 2010;466(7303):263-266.
doi: 10.1038/nature09198
25.Vogel V, Sheetz M. Local force and geometry sensing regulate cell functions. Nat Rev Mol Cell Biol. 2006;7(4):265-275.
doi: 10.1038/nrm1890
26.Han P, Gomez GA, Duda GN, Ivanovski S, Poh PSP. Scaffold geometry modulation of mechanotransduction and its influence on epigenetics. Acta Biomater. 2023;163:259-274.
doi: 10.1016/j.actbio.2022.01.020
27.Penumakala PK, Santo J, Thomas A. A critical review on the fused deposition modeling of thermoplastic polymer composites. Compos B Eng. 2020;201:108336.
doi: 10.1016/j.compositesb.2020.108336
28.Cui X, Li J, Hartanto Y, et al. Advances in extrusion 3D bioprinting: a focus on multicomponent hydrogel-based bioinks. Adv Healthc Mater. 2020;9(15):e1901648.
29.Gillispie G, Prim P, Copus J, et al. Assessment methodologies for extrusion-based bioink printability. Biofabrication. 2020;12(2):022003.
30.Zhang YS, Haghiashtiani G, Hübscher T, et al. 3D extrusion bioprinting. Nat Rev Methods Primers. 2021;1(1):1-20.
doi: 10.1038/s43586-021-00073-8
31.Moroni L, Boland T, Burdick JA, et al. Biofabrication: a guide to technology and terminology. Trends Biotechnol. 2018;36(4):384-402.
doi: 10.1016/j.tibtech.2017.10.015
32.Cindradewi AW, Bandi R, Park CW, et al. Preparation and characterization of cellulose acetate film reinforced with cellulose nanofibril. Polymers (Basel). 2021;13(17):2990.
33.Kahl M, Gertig M, Hoyer P, Friedrich O, Gilbert DF. Ultra-low-cost 3D bioprinting: modification and application of an off-the-shelf desktop 3D-printer for biofabrication. Front Bioeng Biotechnol. 2019;7:184.
34.Costanzo S, Parisi D, Schweizer T, Vlassopoulos D. REVIEW: nonlinear shear rheometry: brief history, recent progress, and challenges. J Rheol. 2024;68(6):1013-1036.
doi: 10.1122/8.0000897
35.Lin L, Jiang S, Yang J, et al. Application of 3D-bioprinted nanocellulose and cellulose derivative-based bio-inks in bone and cartilage tissue engineering. Int J Bioprint. 2022;9(1):637.
36.Van den Eynde M, Van Puyvelde P. 3D printing of poly(lactic acid). Adv Polym Sci. 2018;282:139-158.
doi: 10.1007/12_2017_28
37.Tümer EH, Erbil HY. Extrusion-based 3D printing applications of PLA composites: a review. Coatings. 2021;11(4):390.
38.Zhang L, Yang Q, Zhang K, et al. Research on the integration of industrial design and mechanical product design. IOP Conf Ser Mater Sci Eng. 2020;772(1):012100.
doi: 10.1088/1757-899X/772/1/012100
39.Ji Y, Ji J, Kuang Y, Chen S, Wang D. Development and realization of computer three-dimensional aided design system for industrial design. J Phys Conf Ser. 2021;2074(1):012017.
doi: 10.1088/1742-6596/2074/1/012017
40.Song PP, Qi YM, Cai DC. Research and application of autodesk Fusion360 in industrial design. IOP Conf Ser Mater Sci Eng. 2018;359(1):012037.
doi: 10.1088/1757-899X/359/1/012037
41.Utomo NW, Nazari B, Parisi D, Colby RH. Determination of intrinsic viscosity of native cellulose solutions in ionic liquids. J Rheol. 2020;64(5):1063-1073.
doi: 10.1122/8.0000015
42.Yan ZC, Costanzo S, Jeong Y, Chang T, Vlassopoulos D. Linear and nonlinear shear rheology of a marginally entangled ring polymer. Macromolecules. 2016;49(4):1444-1453.
doi: 10.1021/acs.macromol.5b02651
43.Schweizer T, Schmidheiny W. A cone-partitioned plate rheometer cell with three partitions (CPP3) to determine shear stress and both normal stress differences for small quantities of polymeric fluids. J Rheol. 2013; 57:841-856.
doi: 10.1122/1.4797458
44.Snijkers F, Vlassopoulos D. Cone-partitioned-plate geometry for the ARES rheometer with temperature control. J Rheol. 2011;55:1167-1186.
doi: 10.1122/1.3625559
45.Rhee BO, Lee SH. Evaluation on accuracy of the rheological data of PIM feedstocks. J Jpn Soc Powder Powder Metall. 1999;46(8):830-836.
doi: 10.2497/JJSPM.46.830
46.Castellanos MM, Pathak JA, Colby RH. Both protein adsorption and aggregation contribute to shear yielding and viscosity increase in protein solutions. Soft Matter. 2014;10(1):122-131.
doi: 10.1039/c3sm51994e
47.Schindelin J, Arganda-Carreras I, Frise E, et al. Fiji: an open-source platform for biological-image analysis. Nat Methods. 2012;9(7):676-682.
doi: 10.1038/nmeth.2019
48.Stirling DR, Swain-Bowden MJ, Lucas AM, et al. CellProfiler 4: improvements in speed, utility and usability. BMC Bioinformatics. 2021;22(1):433.
doi: 10.1186/s12859-021-04344-9
49.Kamentsky L, Jones TR, Fraser A, et al. Improved structure, function and compatibility for CellProfiler: modular high-throughput image analysis software. Bioinformatics. 2011;27(8):1179-1180.
doi: 10.1093/bioinformatics/btr095
50.Carpenter AE, Jones R, Lamprecht MR, et al. Cellprofiler: image analysis software for identifying and quantifying cell phenotypes. Genome Biol. 2006;7(10):R100.
doi: 10.1186/gb-2006-7-10-r100
51.Kurowski PM. Finite Element Analysis for Design Engineers. SAE International; 2022. Accessed: Jun. 27, 2023. [Online]. Available from: https:// books. google.gr/books?hl=en&lr=&id=yiOjEAAA QBAJ&oi=fnd&pg=PP1&dq=Finite+element+analysis&ots =pTv6Re0j8Y&sig=CR_7tnbL5aNGEEgOXYfL-QsYfr4& redir_esc=y#v=onepage&q=Finite%20element%20analysis &f=false
52.Carrera E, Cinefra M, Petrolo M, Zappinno E. Finite Element Analysis of Structures through Unified Formulation; 2014. Accessed: Jun. 27, 2023. [Online]. Available: https://books.google.gr/books?hl=en&lr=&id=Ds0u BAAAQBAJ&oi=fnd&pg=PT17&dq=Finite+ element+analysis+of+structures&ots=gS7YPRnJ3 _&sig=1zAQvApZnPqqe1VvAriyxOb0i9o&redir_ esc=y#v=onepage&q=Finite%20element%20analy sis%20of%20structures&f=false
53.Szabó B, Babuška I. Finite Element Analysis: Method, Verification and Validation; 2021. Accessed: Jun. 27, 2023. [Online]. Available: https://books.google.gr/books?hl=en& lr=&id=V_UqEAAAQBAJ&oi=fnd&pg=PP12&dq= Finite+element+analysis&ots=GpxraDUPr9&sig= rt371KK9Ujp01k3vu1vThzxRIXg&redir_esc=y#v= onepage&q=Finite%20element%20analysis&f=false
54.Farah S, Anderson DG, Langer R. Physical and mechanical properties of PLA, and their functions in widespread applications — a comprehensive review. Adv Drug Deliv Rev. 2016;107:367-392.
doi: 10.1016/j.addr.2016.06.012
55.Ramos N, Mittermeier C, Kiendl J. Experimental and numerical investigations on heat transfer in fused filament fabrication 3D-printed specimens. Int J Adv Manuf Technol. 2022;118(5–6):1367-1381.
doi: 10.1007/S00170-021-07760-6
56.Yenilmez B, Temirel M, Knowlton S, Lepowsky E, Tasoglu S. Development and characterization of a low-cost 3D bioprinter. Bioprinting. 2019;13:e00044.
doi: 10.1016/J.BPRINT.2019.E00044
57.Dávila JL, Manzini B, da Fonseca JHL, et al. A parameterized g-code compiler for scaffolds 3D bioprinting. Bioprinting. 2022;27:e00222.
doi: 10.1016/J.BPRINT.2022.E00222
58.Parisi D, Costanzo S, Jeong Y, et al. Nonlinear shear rheology of entangled polymer rings. Macromolecules. 2021;54(6):2811-2827.
doi: 10.1021/ACS.MACROMOL.0C02839/ASSET/ IMAGES/LARGE/MA0C02839_0016.JPEG
59.Appaw C, Gilbert RD, Khan SA. Viscoelastic behavior of cellulose acetate in a mixed solvent system. Biomacromolecules. 2007;8(5):1541-1547.
doi: 10.1021/bm0611681
60.Schulz L, Seger B, Burchard W. Structures of cellulose in solution. Macromol Chem Phys. 2000;201:2008-2022.
doi: 10.1002/1521-3935(20001001)201:15<2008::AID-MAC P2008>3.0.CO;2-H
61.Ferrarezi MMF, Rodrigues GV, Felisberti MI, Goncalves MC. Investigation of cellulose acetate viscoelastic properties in different solvents and microstructure. Eur Polym J. 2013;49:2730-2737.
doi: 10.1016/j.eurpolymj.2013.06.007
62.Lee H, Chaudhuri SR, Krantz WB, Hwang S-T. A model for evaporative casting of polymeric membranes incorporating convection due to density changes. J Membr Sci. 2016;284:161-172.
doi: 10.1016/j.memsci.2006.07.032
63.Das A, Gilmer EL, Biria S, Bortner MJ. Importance of polymer rheology on material extrusion additive manufacturing: correlating process physics to print properties. ACS Appl Polym Mater. 2021;3(3):1218-1249.
doi: 10.1021/ACSAPM.0C01228/ASSET/IMAGES/LARGE/ AP0C01228_0011.JPEG
64.Gudapati H, Parisi D, Colby RH, Ozbolat IT. Rheological investigation of collagen, fibrinogen, and thrombin solutions for drop-on-demand 3D bioprinting. Soft Matter. 2020;16(46):10506-10517.
doi: 10.1039/D0SM01455A
65.Liu Y, Hildner M, Roy O, et al. On the selection of rheological tests for the prediction of 3D printability. J Rheol. 2003;67(4):791.
doi: 10.1122/8.0000612
66.Wu P, Yu T, Chen M, Hui D. Effect of printing speed and part geometry on the self-deformation behaviors of 4D printed shape memory PLA using FDM. J Manuf Process. 2022;84:1507-1518.
doi: 10.1016/J.JMAPRO.2022.11.007
67.Tirumkudulu MS, Punati VS. Solventborne polymer coatings: drying, film formation, stress evolution, and failure. Langmuir. 2022;38(8):2409-2414.
doi: 10.1021/acs.langmuir.1c03124
68.Colby RH. Fiber spinning from polymer solutions. J Rheol. 2023;67(6):1251-1255.
doi: 10.1122/8.0000726
69.Paxton N, Smolan W, Böck T, Melchels F, Groll J, Jungst T. Proposal to assess printability of bioinks for extrusion-based bioprinting and evaluation of rheological properties governing bioprintability. Biofabrication. 2017;9(4):044107.
70.Klemm D, Heublein B, Fink HP, Bohn A. Cellulose: fascinating biopolymer and sustainable raw material. Angew Chem Int Ed. 2005;44(22):3358-3393
71.Liu G, Bhat MP, Kim CS, Kim J, Lee KH. Improved 3D-printability of cellulose acetate to mimic water absorption in plant roots through nanoporous networks. Macromolecules. 2022;55(5):1855-1865.
doi: 10.1021/ACS.MACROMOL.2C00052/ASSET/ IMAGES/LARGE/MA2C00052_0007.JPEG
72.Naghieh S, Chen X. Printability–a key issue in extrusion-based bioprinting. J Pharm Anal. 2021;11(5):564-579.
doi: 10.1016/J.JPHA.2021.02.001
73.Kostag M, Liebert T, Heinze T. Acetone-based cellulose solvent. Macromol Rapid Commun. 2014;35(16):1419-1422.
74.Zhang F, Ma Y, Kondo Y, Breedveld V, Lively RP. A guide to solution-based additive manufacturing of polymeric structures: ink design, porosity manipulation, and printing strategy. J Adv Manuf Process. 2020;2(1):e10026.
doi: 10.1002/AMP2.10026
75.Thayer P, Martinez H, Gatenholm E. Manufacturing of biomaterials via a 3d printing platform. In: 3D and 4D Printing in Biomedical Applications; 2019:81-111.
doi: 10.1002/9783527813704.CH4
76.Łabowska MB, Jankowska AM, Michalak I, Detyna J. Shrinkage of alginate hydrogel bioinks potentially used in 3D bioprinting technology. Key Eng Mater. 2021; 885:39-45.
doi: 10.4028/WWW.SCIENTIFIC.NET/KEM.885.39
77.Zhao M, Geng Y, Fan S, Yao X, Zhu M, Zhang Y. 3D-printed strong hybrid materials with low shrinkage for dental restoration. Compos Sci Technol. 2021;213:108902.
doi: 10.1016/J.COMPSCITECH.2021.108902
78.Ozler SB, Bakirci E, Kucukgul C, Koc B. Three-dimensional direct cell bioprinting for tissue engineering. J Biomed Mater Res B Appl Biomater. 2017;105(8):2530-2544.
doi: 10.1002/JBM.B.33768
79.Zandrini T, Florczak S, Levato R, Ovsianikov A. Breaking the resolution limits of 3D bioprinting: future opportunities and present challenges. Trends Biotechnol. 2023;41(5):604-614.
doi: 10.1016/J.TIBTECH.2022.10.009/ASSET/69CE7A5F-7F1D-4A33-8E82-FF41C5804A19/MAIN.ASSETS/GR4.JPG
80.Ibrahim TO. 3D Bioprinting: Fundamentals, Principles and Applications; 2016. Accessed: Dec. 11, 2024. [Online]. Available from: https://books.google.gr/books?hl=en&lr=&id=vcEOCAAAQBAJ&oi=fnd&pg=PP1&dq=Microscale+3D+printing+for+biomedical+applications+ozbolat&ots=Uw3RujHFUm&sig=nmeMiEbuc3I-5Z6_PQMYrqWHi10&redir_esc=y#v=onepage&q=Microscale%203D%20printing%20for%20biomedical%20applications%20ozbolat&f=false
81.Law ACC, Wang R, Chung J, et al. Process parameter optimization for reproducible fabrication of layer porosity quality of 3D-printed tissue scaffold. J Intell Manuf. 2024;359(4):1825-1844.
doi: 10.1007/S10845-023-02141-0/TABLES/15
82.Meka SRK, Chacko LA, Ravi A, Chatterjee K, Ananthanarayanan V. Role of microtubules in osteogenic differentiation of mesenchymal stem cells on 3D nanofibrous scaffolds. ACS Biomater Sci Eng. 2017;3(4):551-559.
doi: 10.1021/acsbiomaterials.6b00725
83.Radhakrishnan AV, Jokhun DS, Venkatachalapathy S, Shivashankar GV. Nuclear positioning and its translational dynamics are regulated by cell geometry. Biophys J. 2017;112(9):1920-1928.
doi: 10.1016/j.bpj.2017.03.025
84.Alisafaei F, Jokhun DS, Shivashankar GV, Shenoy VB. Regulation of nuclear architecture, mechanics, and nucleocytoplasmic shuttling of epigenetic factors by cell geometric constraints. Proc Natl Acad Sci U S A. 2019;116(27):13200-13209.
85.Du R, Li D, Huang Y, et al. Effect of mechanical stretching and substrate stiffness on the morphology, cytoskeleton and nuclear shape of corneal endothelial cells. Med Novel Technol Dev. 2022;16:100180.
doi: 10.1016/j.medntd.2022.100180
86.Werner M, Blanquer SB, Haimi SP, et al. Surface curvature differentially regulates stem cell migration and differentiation via altered attachment morphology and nuclear deformation. Adv Sci. 2017;4(2):1600347.
87.Bidan CM, Kommareddy KP, Rumpler M, et al. How linear tension converts to curvature: geometric control of bone tissue growth. PLoS One. 2012;7(5):e36336.
doi: 10.1371/journal.pone.0036336
88.Ruiz SA, Chen CS. Emergence of patterned stem cell differentiation within multicellular structures. Stem Cells. 2008;26(11):2921-2927.