

Evaluation of 3D-printed silicone phantoms with controllable MRI signal properties

3D printing technology is widely used for creating magnetic resonance imaging (MRI) phantoms, mimicking tissue, and contrast levels found in real patients. Traditionally, 3D-printed structures were filled with gels containing contrast agents. Recently, studies have shown that some 3D-printed materials can be directly used to create MRI phantoms. However, each material typically produces a unique MRI signal, requiring specific materials for desired contrasts, or a single material can produce various contrasts, but these often do not match the properties of different soft tissues. In this study, we aimed to investigate MRI signal properties of 3D-printed phantoms made of silicone in MRI. We determined the MRI relaxation times of extrusion silicone 3D-printed phantoms from different materials with different infill densities and correlated them with the reference values in soft tissues. We also evaluated the performance of our approach using realistic tumor phantoms. A reproducibility analysis as well as longitudinal stability analysis was also performed. The experimental results showed that the 3D-printed silicone phantoms could achieve MRI signal properties with good correspondence to a range of soft tissues and organs (T1 relaxation time range from 850.8 to 1113.3 ms and T2 relaxation time range from 22.6 to 140.7 ms). Our results demonstrated good stability of the T1 and T2 values over time and also good agreement for the replicas compared to the original samples, confirming the reproducibility of the printed materials. A good agreement was observed between the MRI signal property in tumor phantoms and the reference values of invasive ductal carcinoma of the breast in patients.
1. Introduction
Magnetic resonance imaging (MRI) is a widely used noninvasive tomographic imaging technique, renowned for its exceptional soft tissue contrast and high spatial resolution.1 In oncology, these attributes, combined with the versatility of various imaging sequences, allow for detailed visualization of tumor heterogeneity, aiding in malignancy detection, characterization, and improving diagnosis, treatment planning, and patient outcomes. The integration of radiomics with artificial intelligence (AI) shows great promise in characterizing tumor heterogeneity and supporting personalized disease assessment and treatment prediction.2 However, the reliability and generalizability of these radiomics-based AI models depend on data quality, which is often compromised by variations in imaging protocols across different systems, centers, and MRI manufacturers. Standardized protocols are essential for ensuring data consistency throughout the “big data chain,” from acquisition to pre-processing and mining, enabling robust AI applications. Without standardization, inconsistencies hinder dataset aggregation, complicate data mining, and weaken AI models’ predictive power. Developing and adopting standardized imaging protocols is crucial to minimizing variations, improving data comparability, and enhancing the reproducibility and scalability of radiomics-AI workflows, ultimately supporting their clinical adoption.3
To overcome these challenges, the development of advanced imaging phantoms is essential for harmonizing and standardizing image acquisition protocols, as well as image processing and analysis techniques. MRI phantoms have traditionally been made using aqueous solutions or gel-like materials. For example, phantoms designed for pelvic cancer studies featured a pelvic-shaped container with inserts simulating lesions using polystyrene spheres and agar gel.4 A more recent multimodal phantom compatible with computed tomography (CT), positron emission tomography (PET), and MRI employed a tissueequivalent gel for cross-modality imaging, though its reproducibility and long-term stability remain challenges.5 Another design used an acrylic framework with cylinders filled with various materials to mimic MRI properties, but customization and stability issues persist.6 These approaches highlight ongoing challenges in developing fully customizable, stable, and reproducible MRI phantoms.
In recent years, 3D printing technology has gained importance in the medical field, in particular in the area of anatomical models, where it has set a new standard due to its high flexibility in spatial design. This has also made it interesting for the fabrication of medical imaging phantoms. While it has already been widely explored and applied in CT phantoms,7 for a long time, no 3D-printable material that was also visible in MRI was found. Thus, for the introduction of more anatomical shapes in MRI phantoms, one common approach was to 3D-print a mold and manufacture the phantom via molding,8,9 but this took away some of the flexibility and was a lot more timeconsuming. Another approach was to 3D-print a hollow structure and fill it with gels and fluids.10,11 However, this came with the same limitations in preparation and maintenance as described above.
For the use in a cervical spine model for MRI-guided therapy simulation, Mitsouras et al.12 analyzed the MRI properties of 17 3D-printable materials, and finally detected one, which was visible in MRI. This material was the hightemperature RGD 525 material from Stratasys (Stratasys Ltd., EdenPrairie, MN, USA), a photopolymer printable with their Objet Polyjet printers, using inkjet printheads and curing with UV light. Subsequently, this material was used in studies for the evaluation of MRI-based radiomic features13 for attenuation correction in PET/MRI14 and for a multi-purpose MRI phantom.15 Two Polyjet support materials (SUP705 in ref.15 and SUP705 in ref.16) were additionally found to have good MRI visibility, expanding the options for this printer. A recent study16 even suggested combination with non-visible Polyjet materials in a matrix, using different percentages for tuning the imaging properties. While the resulting T1 and T2 values could actually be influenced in a certain range, unfortunately, none of the Polyjet materials or material mixtures could reach T1 values in the range of human soft tissues.
Many other materials were examined for their use in MRI phantoms, including materials for other 3D printing technologies, with little success.17 Stereolithography (SLA) 3D printing is also using photopolymerization as a concept, but in this technology, a light source is used to cure liquid photosensitive resin into hardened plastic. Although a similar principle is used as in the Polyjet printing, MRI- visible SLA materials have only been found for being able to mimic cortical bone using ultrashort echo time (UTE) MRI, a special technique to make human bone visible18 (photosensitive resin RP-405-CA01 by Prismlab, China Ltd, Shanghai, China) and for the printing of a multimodal quality control phantom19 (MDT-white by Meditool, China). Regarding fused filament fabrication (FFF, also known as FDM, fused deposition modeling), the most common 3D-printing method, where a filament is melted and applied onto the printed object on a building platform in a layer-wise manner, ABS is the only material that has been attributed partial visibility for some MRI sequences.17,19 Recently, MRI-visible phantoms of brain materials were created using a relatively new 3D printing technique called two-photon polymerization (2PP), which is based on the non-linear optical effect of two-photon absorption and enables printing of features in the sub-micron region.20 While this high resolution might be interesting for the generation of radiomics features in MRI phantoms, it is restricted to very limited sizes and therefore not applicable for the real-size printing of human body parts.
With the aim of finding materials with similar T1 and T2 relaxation values as human tissue, Yunker et al.17 performed a huge study on molding and 3D printing materials, reviewing more than 1200 materials and reporting measurements on 100. Out of 70 printing materials, only one acrylonitrile butadiene styrene (ABS) was found partially visible. In contrast, out of 30 measured molding silicones, 20 had T1 and T2 values in the range of human tissues. These findings underscore the significant lack of MRI-visible 3D printing materials suitable for customized phantom design, highlighting the need for further research and innovation in this area. Therefore, in the current study, we attempted to combine the advantages concerning the T1 and T2 range of silicone materials with the advantages of flexible design and ability for material tuning previously demonstrated for CT phantoms,21–23 by using our custommade silicone extrusion 3D printer24 for the fabrication of MRI phantoms in the human tissue range. The novelty of our work lies in introducing a new framework that, for the first time, demonstrates how altering the infill density of MRI-visible 3D printing silicone materials can generate a range of MRI contrasts closely matching those of human soft tissues. Our approach uniquely combines the inherent properties of MRI-visible 3D printing materials with infill density adjustments to achieve realistic, tissue-mimicking contrasts. This approach has not been introduced before, and since phantoms with adjustable MRI contrast are rare, the resulting accurate alignment with soft tissue MRI properties with a framework proposed (combination of 3D printing materials with infill density variations) holds, therefore, an innovative aspect as it represents a significant advancement in the MR imaging phantom development field.
In this study, we analyzed the T1 and T2 relaxation times of three different 3D-printed silicone materials and their ability to mimic various soft tissues MRI signal properties by altering the printed infill density. The reproducibility and longitudinal stability of the proposed phantoms were also evaluated. Additionally, tumor phantoms were fabricated, replicating MRI contrast observed in patients with invasive ductal carcinoma of the breast.
2. Materials and methods
2.1. 3D printing technique
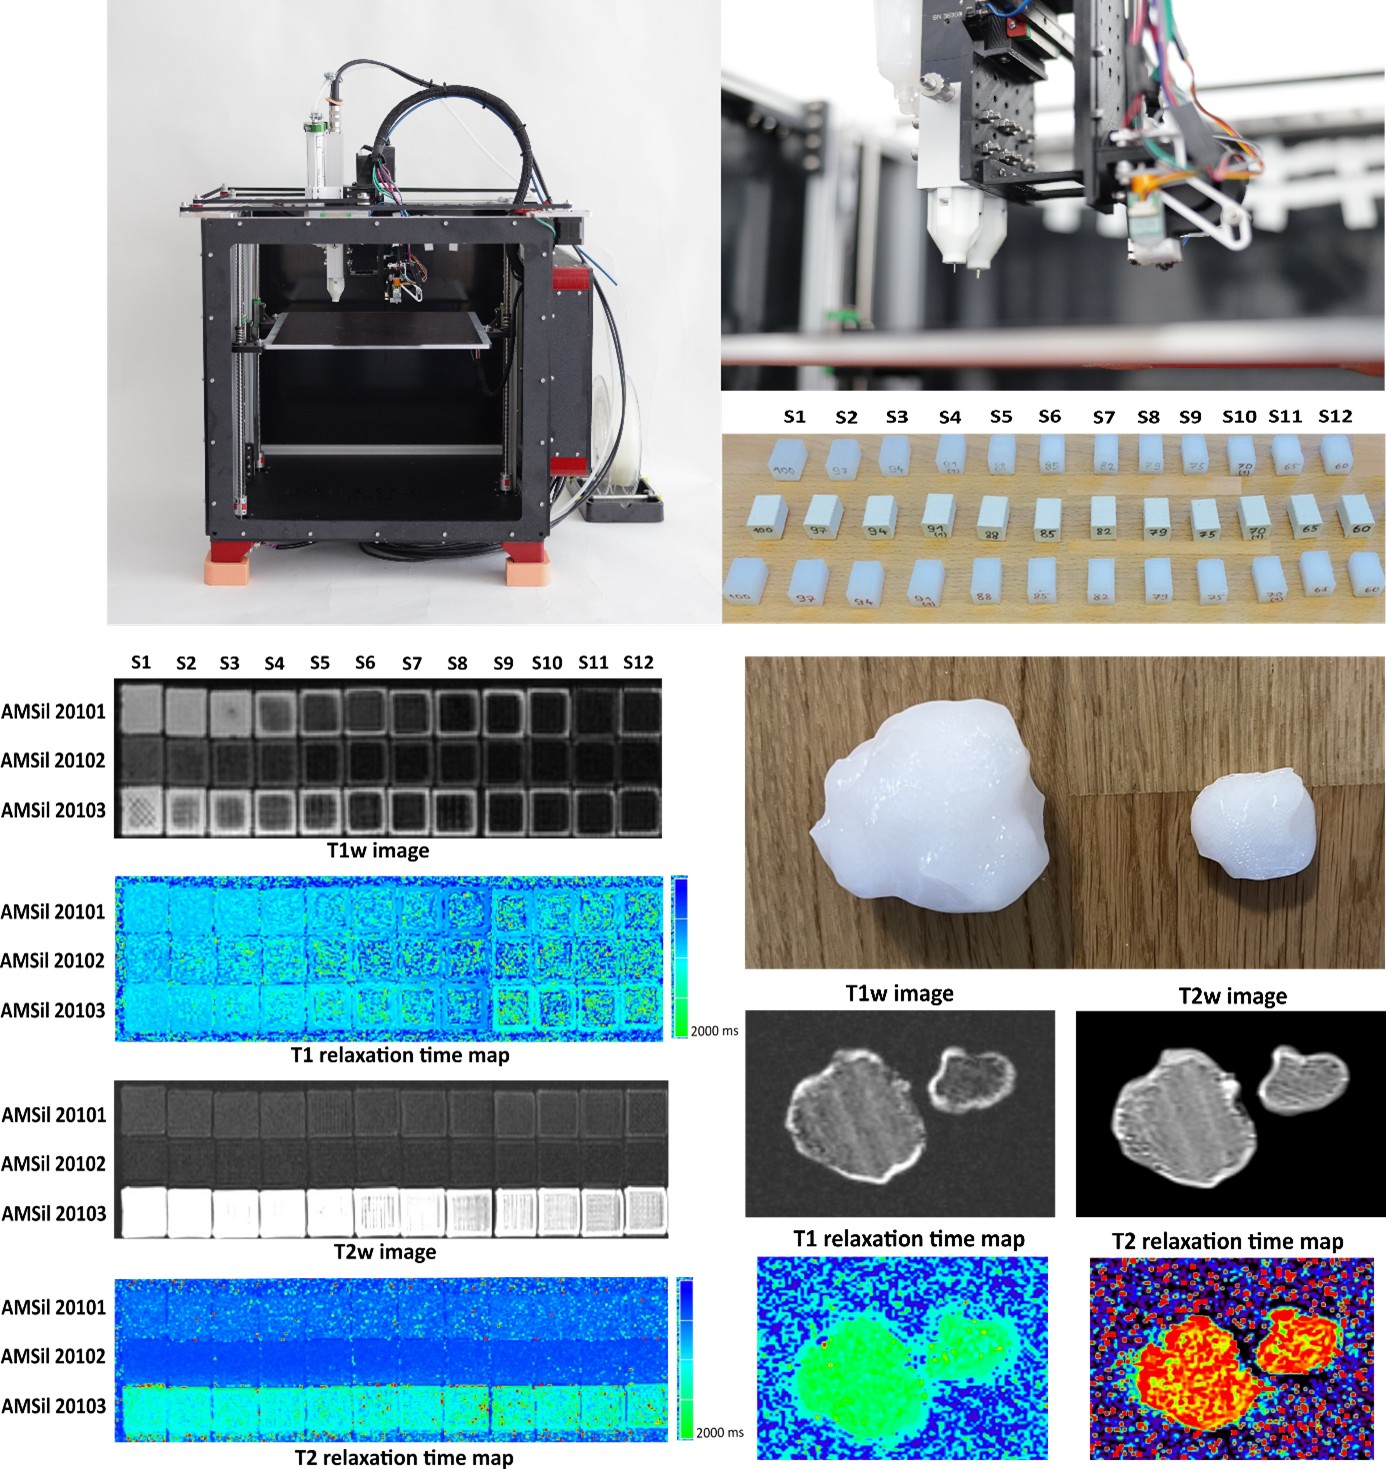
For the fabrication of all phantoms used in this study, we utilized a custom-built multi-material 3D printer (Figure 1, left), designed based on a commercially available filament printer (Railcore II 300 ZL, Railcore Labs LIC, USA). The standard filament printhead was enhanced with a two-component fluid extruder (Viscotec Vipro-HEAD 3/3, Viscotec GmbH, Töging am Inn, Germany), enabling the printing of either a two- component silicone or two distinct high-viscosity fluidic materials within a single print. Further details on the printer, including the calibration procedure, can be found in published literature.24 In the current study, a 0.41 mm nozzle was used with three different single-component silicone rubbers, Elkem AMSil 20201, 20202, and 20203 (Elkem Silicones SAS, Lyon, France). These high-viscosity silicones undergo condensation-based crosslinking upon exposure to air.

Figure 1. 3D printer and printed samples. (A) The multi-material printer. (B) Both are independently controllable fluid extruders. (C) The 3D-printed samples related to the three printed materials (bottom: Elkem AMSil 20201; middle: Elkem AMSil 20202; top: Elkem AMSil 20203) at different infill densities (S1–S12).25
2.2. 3D-printed phantom design
2.2.1 Sample design
The same silicone samples as previously reported21 were used in this study, consisting of rectangular blocks measuring 14 × 14 × 20 mm3. The infill densities were adjusted in two different increments to achieve a range of 12 levels. Specifically, between 60% and 75%, the infill density was increased in steps of 5%, while between 79% and 100%, the density was increased in smaller steps of 3%. For two levels (70% and 91%), five additional samples (replicas) were fabricated for each level to check for reproducibility, while all other levels were printed once of each material. In all samples, the inner part with the respective infill densities was embedded in a solidly printed outer shell consisting of two top and bottom layers as well as two contour lines on each side. A gyroid pattern was used for the infill in all samples, but in the 100% samples, where a rectilinear pattern was used. The printing speed was set to 20 mm/s. G-code for printing was generated using PrusaSlicer software V2.3.0 (Prusa Research, Prague, Czech Republic).
2.2.2. Anatomical use case (breast tumor phantoms)
To demonstrate the applicability of the proposed tuning method for developing anatomical MRI phantoms, breast tumor phantoms were selected as the first use case. Realistic tumor models, derived from human MRI data of invasive ductal carcinoma patients, were used to 3D-print two tumor phantoms. The T1 and T2 relaxation times for invasive ductal carcinoma were reported 1183 ± 256 and 68 ± 13 ms, respectively, according to a published work.24 AMSil 20201 with infill densities of 97% and 94% was chosen for printing the two tumor phantoms, respectively (Figure 2). As for the samples, a gyroid infill pattern was used and two contour lines/top and bottom layers were added. A solid support structure was generated and printed using the original filament printhead with PLA material to support the overhanging structure during simultaneous silicone printing.

Figure 2. Tumor phantoms during slicing in Prusaslicer. The phantoms were printed from AMSil 20201 silicone (red) with 97% (left) and 94% (right) of infill, surrounded with two contour lines. Filament support (black) was used to enable the printing of the overhangs.
2.3. MRI of the samples
All measurements were performed using a 3T MRI scanner (MAGNETOM Prisma Fit, Siemens Healthineers, Erlangen, Germany) with a dedicated 32-channel proton (¹H) head coil in the coronal plane. The imaging protocol included T1-weighted (T1w) and T2-weighted (T2w) imaging, along with T1 and T2 mapping, using the parameters listed in Table 1.
Table 1. Pulse sequences and parameters used for T1w and T2w imaging and T1 and T2 mapping of the phantoms
| Pulse sequence | Repetition/Echo time, TR/TE (ms) | In-plane resolution (mm2) | Flip angle, FA (°) | Slice thickness, SL (mm) | Bandwidth, BW (Hz/Px) | NEX |
|---|---|---|---|---|---|---|
| T1_fl2d_cor | 250/2.84 | 0.7 × 0.7 | 70 | 2.0 | 355 | 1 |
| T2_tse_cor | 4000/89 | 0.7 × 0.7 | 150 | 2.0 | 260 | 3 |
| T1map (fl3d_GRE) | 15/2.65 | 0.4 × 0.4 | 5/26 | 2.0 | 280 | 1 |
| T2map (SE2d) | 1680/(13.8–150) | 0.5 × 0.5 | 180 | 2.0 | 225 | 1 |
Notes: T1_fl2d_cor—two-dimensional fluid attenuated T1w pulse sequence in coronal plane;
T2_tse_cor turbo—spin echo T2w pulse sequence in coronal plane;
T1map (fl3d_GRE)—three-dimensional fluid-attenuated gradient echo sequence;
T2map (SE2d)—two-dimensional spin echo pulse sequence.
Abbreviation: NEX, number of excitations.
2.4. Relaxation time calculation
The pulse sequences for imaging and relaxation time mapping were loaded and adapted from the Siemens anatomical protocol. Relaxation time maps were generated automatically using the vendor syngo MR E11 software. We used a variable flip angle gradient refocused imaging approach25 for rapid T1 relaxation time calculation based on two-point (flip angles of 5° and 26°) fits. For T2 maps, the data were acquired with a multi-echo sequence (the range of TEs was 13.8–150 ms) and fitted to the monoexponential decay model with an offset.26 The 3D slicer was used as an image viewer and for the evaluation of T1 and T2 values relaxation time maps of the phantoms. We placed a fixed 20 × 20 pixel circular region of interest (ROI) within the inner slices of the phantom, ensuring maximum coverage of the sample’s inner area. The reported mean and SD of the relaxation time were calculated across all pixels within all ROIs. In this study, printed samples with an SD of 20–30% of their main values are considered acceptable for MRI measurements, as this variation is also observed in the T1 and T2 values of human tissues and organs across different MRI setups and protocols.27
2.5. Reproducibility and longitudinal stability analysis
We performed a reproducibility analysis to ensure the reproducibility of proposed silicone phantoms. Different infill density levels of each material (replicas) were printed (Section 2.2.1) and were scanned using the same MRI setup (Section 2.3). In addition, in order to evaluate the longitudinal stability of the measured T1 and T2 relaxation times of the phantoms, we report the results of the relaxation time assessments over the period of 7 months by repeating the MRI measurements of samples three times (by intervals of 2–3 months). In all cases, we calculated the relaxation time values by applying the same methodology described in Section 2.4. Reproducibility is measured by the coefficient of variation (CV) of T1 and T2 measurements across the three time points similar to those reported in a published literature.28
3. Results
3.1. 3D-printed samples results
The 3D-printed samples from three materials printed with different infill densities S1–S12 (Section 2.2.1) were scanned (Section 2.3) and T1w and T2w images as well as T1 and T2 relaxation time maps and values are represented (Figures 3 and 4). The calculated T1 and T2 relaxation times of the samples are summarized in Tables 2 and 3. T1 relaxation times ranged between 866.6 and 1198.6 ms, 879.4 and 1221.8 ms, 978.7 and 1338.9 ms, for AMSil 20101, AMSil 20102, and AMSil 20103, respectively. T2 values were in the range of 50.2 and 75.6 ms, 20.8 and 37.2 ms, and 124.1 and 177.7 ms, for AMSil 20101, AMSil 20102, and AMSil 20103, respectively. According to our results, the T1 relaxation time correlated inversely (for 82–100% infill) with the percentage of infill density for the three printing materials used. Although the trend was not very linear, we observed generally higher T1 values for samples with lower infill density, while lower T1 values were obtained for samples with higher infill density. For T2 relaxation time, different value ranges were observed across the materials used. In general, samples made from AMSil 20103 exhibited greater T2 variations compared to those made from AMSil 20102 and AMSil 20101, with AMSil 20103 showing the highest T2 values and AMSil 20102 the lowest. Samples with lower infill densities generally showed high SD values (mainly samples with infill density less than 88%). However, in this study, although all sample results are reported, we consider only samples with SD 20–30% of their main values acceptable for MRI measurements. According to Tables 1 and 2, this mainly belongs to the samples with an infill density of more than 88% (S1–S4). For these samples, we observed that the T1 and T2 relaxation times of the printed samples match well with a wide range of different human soft tissues (Tables 2 and 3), and SD values also have agreement with realistic soft tissue’s SD range. The T1 relaxation time of the different samples showed a good similarity with the pancreas, liver, muscle, white matter, myocardium, kidney cortex, and spleen. In addition, the T2 relaxation time found in different samples was in good match with different tissues such as the muscle, liver, cartilage, myocardium, white matter, prostate, uterus myometrium, gray matter, and fat.
Table 2. T1 relaxation time values for the three printed materials at different infill densities as well as for different soft tissue with corresponding values found in the printed materials with S1–S4
| Sample (silicone ratio%) | T1 relaxation time (ms) | ||||||
|---|---|---|---|---|---|---|---|
| AMSil 20101 | AMSil 20102 | AMSil 20103 | Soft tissue29–35 | ||||
| Mean | SD | Mean | SD | Mean | SD | Anatomical structure (mean ± SD) | |
| S1 (100) | 866.6 | 72.7 | 879.4 | 74.0 | 978.7 | 77.9 | Pancreas (725 ± 71) Liver (809 ± 71) Muscle (898 ± 33) White matter (943 ± 57) Myocardium (1116 ± 60) Kidney cortex (1142 ± 154) Spleen (1232 ± 92) |
| S2 (97) | 850.8 | 71.3 | 926.6 | 95.5 | 990.3 | 96.8 | |
| S3 (94) | 923.2 | 120.5 | 1122.3 | 700.8 | 1088.2 | 106.6 | |
| S4 (91) | 992.3 | 165.0 | 1173.3 | 517.2 | 1113.3 | 147.8 | |
| S5 (88) | 1063.9 | 339.2 | 1221.8 | 874.2 | 1195.5 | 596.2 | |
| S6 (85) | 1198.6 | 449.4 | 1103.7 | 738.8 | 1249.1 | 663.2 | |
| S7 (82) | 1182.4 | 607.2 | 1215.1 | 900.2 | 1338.9 | 689.1 | |
| S8 (79) | 1138.4 | 846.2 | 1092.6 | 813.4 | 1278.2 | 909.8 | |
| S9 (75) | 1144.3 | 722.7 | 989.4 | 818.9 | 1211.1 | 969.8 | |
| S10 (70) | 1178.8 | 889.6 | 1051.3 | 816.4 | 1173.7 | 740,.3 | |
| S11 (65) | 1153.5 | 837.4 | 1063.3 | 747.1 | 1208.6 | 929.2 | |
| S12 (60) | 1149.4 | 952.1 | 1120.3 | 784.0 | 1131.6 | 909.8 | |
Note: We consider samples with SD 20–30% of their main values acceptable for MRI measurements, which are Abbreviations: MRI, magnetic resonance imaging; SD, standard deviation. highlighted in boldface.
Abbreviations: MRI, magnetic resonance imaging; SD, standard deviation.
Table 3. T2 relaxation time values for the three printed materials at different infill densities as well as for different soft tissue with corresponding values found in the printed materials with S1–S4
| Sample (silicone ratio%) | T2 relaxation time (ms) | ||||||
|---|---|---|---|---|---|---|---|
| AMSil 20101 | AMSil 20102 | AMSil 20103 | Soft tissue29–33,36, 37–41 | ||||
| Mean | SD | Mean | SD | Mean | SD | Anatomical structure (mean ± SD) | |
| S1 (100) | 72.9 | 15.2 | 37.2 | 11.2 | 140.7 | 25.9 | Muscle (29 ± 4) Liver (34 ± 4) Cartilage (37 ± 4) Myocardium (39 ± 5) White matter (65 ± 6) Prostate (74 ± 9) Myometrium of the uterus (79 ± 10) Gray matter (109 ± 11) Fat (121 ± 20) |
| S2 (97) | 53.4 | 20.4 | 22.6 | 7.8 | 124.1 | 32.5 | |
| S3 (94) | 50.2 | 21.5 | 20.9 | 9.0 | 129.6 | 66.3 | |
| S4 (91) | 58.8 | 88.5 | 19.5 | 9.8 | 136.0 | 40.4 | |
| S5 (88) | 57.7 | 91.0 | 21.1 | 11.9 | 134.6 | 68.5 | |
| S6 (85) | 65.2 | 92.2 | 22.1 | 11.8 | 177.7 | 296.6 | |
| S7 (82) | 75.6 | 70.1 | 20.8 | 10.9 | 163.5 | 42.2 | |
| S8 (79) | 54.0 | 85.6 | 29.7 | 18.4 | 159.8 | 66.2 | |
| S9 (75) | 67.8 | 88.8 | 21.6 | 17.2 | 163.0 | 289.9 | |
| S10 (70) | 57.7 | 138.9 | 21.3 | 15.6 | 147.0 | 106.9 | |
| S11 (65) | 55.1 | 194.2 | 22.0 | 18.6 | 147.5 | 129.1 | |
| S12 (60) | 51.2 | 122.0 | 22.5 | 25.8 | 176.3 | 81.5 | |
Note: We consider samples with SD 20–30% of their main values acceptable for MRI measurements, which are highlighted in boldface.
Abbreviations: MRI, magnetic resonance imaging; SD, standard deviation.

Figure 3. T1w/T2w imaging, and T1 and T2 relaxation time mapping related to the three printed materials at different infill densities.

Figure 4. Graphs visualizing the T1 and T2 relaxation time values for the three printed materials at different infill densities.
3.2. 3D-printed anatomical phantom results
The two tumor phantoms were successfully printed and scanned (Sections 2.2.2 and 2.3). The T1 and T2 relaxation times of the 3D-printed large tumor were 950 ± 190 and 96.8 ± 29 ms, respectively. In addition, the T1 and T2 relaxation times of the 3D-printed small tumor were 1002 ± 107 and 95 ± 18 ms, respectively (Figure 5).

Figure 5. T1w/T2w imaging and T1 and T2 relaxation time mapping related to the two tumor phantoms used in this study.
3.3. Analysis results for replicas
The T1 and T2 relaxation times from the six replicas related to the two materials at 91% and 70% infill densities were calculated (Table 4). The calculated mean and SD values found over all the replicas for the three materials and different infill densities revealed a good reproduction of the original densities (Table 5).
Table 4. T1 relaxation time values for the three materials at infill densities 91% and 70% for replicas and mean and SD over all T1 relaxation time values of replicas
| T1 relaxation time (ms) | ||||||
|---|---|---|---|---|---|---|
| Infill density = 91% | Infill density = 70% | |||||
| AMSil 20101 | AMSil 20102 | AMSil 20103 | AMSil 20101 | AMSil 20102 | AMSil 20103 | |
| Replica 1 | 992.3 | 1173.3 | 1113.3 | 1178.8 | 1051.3 | 1173.7 |
| Replica 2 | 731.15 | 1048.4 | 1040.49 | 797.84 | 771.4 | 1251.18 |
| Replica 3 | 691.15 | 1009.08 | 1024.23 | 851.28 | 753.25 | 1185.29 |
| Replica 4 | 710.24 | 977.44 | 1000.79 | 856.79 | 766.22 | 910.59 |
| Replica 5 | 729.93 | 1036.57 | 1020.05 | 717.65 | 794.4 | 998.26 |
| Replica 6 | 846.79 | 950.09 | 1036.86 | 838.51 | 752.3 | 1030.64 |
| Mean | 783.5 | 1032.5 | 1039.3 | 873.4 | 814.8 | 1091.5 |
| SD | 115.8 | 78.05 | 38.8 | 158.2 | 116.8 | 131.2 |
Abbreviation: SD, standard deviation.
Table 5. T2 relaxation time values for the three materials at infill densities 91% and 70% for replicas and mean and SD over all T1 relaxation time values of replicas
| T2 relaxation time (ms) | ||||||
|---|---|---|---|---|---|---|
| Infill density = 91% | Infill density = 70% | |||||
| AMSil 20101 | AMSil 20102 | AMSil 20103 | AMSil 20101 | AMSil 20102 | AMSil 20103 | |
| Replica 1 | 58.8 | 19.5 | 136.0 | 57.7 | 21.3 | 147.0 |
| Replica 2 | 53.8 | 29.0 | 182.9 | 93.0 | 45.1 | 174.8 |
| Replica 3 | 64.2 | 38.2 | 196.5 | 66.2 | 56.7 | 153.2 |
| Replica 4 | 54.4 | 43.7 | 171.3 | 62.1 | 53.2 | 190.3 |
| Replica 5 | 74.7 | 34.4 | 194.9 | 72.9 | 55.8 | 169.7 |
| Replica 6 | 55.8 | 27.7 | 156.2 | 47.8 | 63.7 | 176.1 |
| Mean | 60.2 | 32.1 | 172.9 | 66.6 | 49.3 | 168.5 |
| SD | 8.02 | 8.5 | 23.5 | 15.4 | 14.9 | 15.9 |
Abbreviation: SD, standard deviation.
3.4. Longitudinal stability analysis results
From Tables 2 and 3, we observed that samples S1–S4 primarily exhibited acceptable variability, with a smaller SD (20–30% of the main values) for T1 and T2 measurements. Therefore, we selected these samples to demonstrate the long-term stability of the relaxation times. The T1 and T2 relaxation time measured for the three materials over the three time points as described in Section 2.5 is represented in Figure 6. The stability of the phantoms over three time points was assessed by CV to assess the reproducibility of T1 and T2 relaxation times for all materials at these different time points and the related CV% are reported in Table 6. We observed that the CV of T1 was below 5% in half of the cases and below 10% in the other half. Additionally, the CV of T2 was under 22% in almost all cases. These findings highlight the reliability of these phantoms as robust standards for longitudinal studies. Overall, the T1 and T2 values of all three materials demonstrated good longitudinal stability, particularly for T1.

Figure 6. T1 and T2 relaxation time values related to samples S1–S4 for the three time points acquired for longitudinal stability analysis.
Table 6. Coefficient of variation (%) related to T1 and T2 relaxation times for all three materials at these different time points for S1–S4 samples
| Phantom | Relaxation time | S1 CV% | S2 CV% | S3 CV% | S4 CV% |
|---|---|---|---|---|---|
| AMSil20101 | T1 | 3.6 | 3.5 | 4.6 | 6.5 |
| T2 | 21.4 | 6.4 | 3.0 | 4.5 | |
| AMSil20102 | T1 | 4.4 | 6.2 | 6.9 | 9.1 |
| T2 | 31.3 | 11.8 | 11.2 | 17.6 | |
| AMSil20103 | T1 | 3.8 | 3.5 | 5.3 | 6.1 |
| T2 | 18.0 | 15.9 | 13.3 | 11.4 |
Abbreviation: CV, coefficient of variation.
4. Discussion
3D printing technology has become an integral part of the production of medical imaging phantoms.12,13,16,23,29 Anthropomorphic 3D-printed imaging phantoms, designed to replicate tissue and contrast levels in actual patients in terms of MRI signal properties, are particularly useful. Determination of the longitudinal and transversal relaxation times (T1 and T2) of tissuemimicking materials is essential for optimizing imaging sequences and achieving the highest possible contrast between healthy and pathological tissue. Therefore, these phantoms potentially aid in optimizing and comparing image quality across different imaging systems, conducting dosimetry, performing quality control, and defining imaging protocols. Furthermore, such phantoms can be of great importance in the verification of radiomics studies to assess the reproducibility and repeatability of radiomics features used in AI-based radiomics models.
This study focused on the determination of the MRI relaxation times of extrusion silicone 3D-printed phantoms. The ability to replicate tissue-mimicking MR properties through simple modifications to the infill density of silicone materials offers a new, versatile, and scalable approach. This simple but useful approach is introduced for the first time in this study and significantly enhances the practicality and utility of 3D-printed phantoms for MR imaging—an area where achieving realistic tissue properties has traditionally been very challenging. Considering the high values of SD for samples with infill density of less than 88%, we only report samples with SD 20–30% of their main values acceptable for MRI measurements (mainly belong to S1– S4). For these acceptable cases, the 3D-printed samples made of three different materials were able to produce a T1 relaxation time spectrum in the range of 850.8–1113.3 ms and T2 relaxation time spectrum in the range of 22.6–140.7 ms, which correspond greatly with a range of relaxation times of human soft tissue and organs at 3T.29–39
We conducted our measurements using imaging sequences provided by the imaging machine vendor. These clinically available protocols are fast, efficient, and easily implementable in routine clinical examinations. Our MRI measurements were repeated (three times with interval of 2–3 months) and demonstrated good longitudinal stability; this was possible because the experiments were performed under the same conditions and with identical sequence parameters, scanner, hardware, k-space fill, and T1 and T2 calculation method. Experimental results demonstrated that by minimizing factors contributing to variations in relaxation times, the most suitable material with relaxation properties similar to human tissue can be identified. However, a high level of standardization could be more difficult to achieve in a multicenter study. Since differences among scanners from different manufacturers may impede the use of identical protocols at every center, a common consensus on relaxometry methodology is necessary. Using established sequences and protocols, multicenter study standardization may be achieved; the obtained values can be compared in repeated studies on a given subject, between subjects, and in multicenter examinations, which may enhance the use of the relaxometry in image diagnostics and improve the development of quantitative MRI.
We also investigated the performance of our approach using realistic anatomical phantoms (tumor models). The infill density of the printed tumor phantoms was selected according to the resulting T1 and T2 relaxation times (Tables 2 and 3) for the samples and their match with the values reported for invasive ductal carcinoma patients. However, we should note that it was not possible to find a sample that matched both the T1 and T2 values of invasive ductal carcinoma of the breast. In addition, although the samples with lower infill density (especially for T1 values) matched better with the values found in invasive ductal carcinoma patient, we chose higher infill density (we selected infill densities 0.97% and 0.94%) for the two printed tumor phantoms to avoid the high SD. We observed good agreement, especially for the T1 relaxation time of printed tumor phantoms and the reference values of the invasive ductal carcinoma patient.
Our study advances previous research in several key areas. First, the proposed phantoms achieve significantly higher T1 relaxation times (over 1000 ms) compared to earlier studies, making them more realistic for mimicking the MRI properties of a wide range of soft tissues (see Table 2). Additionally, we introduce a method for generating a spectrum of MRI contrasts using a single material, overcoming the limitation of requiring specific materials for each desired MRI signal property. Finally, our phantom offers the added advantage of flexibility. The only previous study that proposed a 3D printed-based method to reproduce a range of MRI contrasts from a solid material was able to report a maximum T1 relaxation time of 158 ms, which is not consistent with many soft tissue T1 relaxation times.9 However, our study improves this study as it can achieve a significantly higher T1 relaxation time in the printed materials and the 3D-printed samples also have the advantage of being flexible compared to the phantoms proposed in this study. Flexible soft tissue materials are needed for imaging phantoms used for various scenarios where anatomical deformations are to be simulated, for example, phantoms with respiratory movements or motion-adaptive radiotherapy treatments.21 In another similar study,16 a soft, silicone-like material was presented that has visibility and MRI properties similar to some organ tissues with a T1 relaxation time of up to 1000 ms. Although high T1 values were achieved for their phantoms, in their approach distinct MRI signal properties can only be achieved according to the material properties of the available commercial silicones and a target range of MRI contrast could not be achieved.
Relaxation times have a major influence on the quality of MR images as follows: proper weighting improves tissue differentiation, the choice of T1 or T2 affects noise and resolution, and reduces the occurrence of image artifacts. Therefore, knowing the T1 and T2 values of different tissues can contribute to better contrast differentiation between healthy tissue and lesions, which in turn can improve the sensitivity and specificity of different AI methods and MRI techniques. For example, improved signal-to-noise ratio (SNR) and resolution enable the detection of small morphological details achieved by better visibility of lesions, which together with the large contrast difference between healthy tissue and lesions can substantially increase the diagnostic accuracy of clinical MRI examination.
We also acknowledge some limitations of this proposed approach. We observed that SD for the T1 and T2 values were high for samples with a lower infill density. Accurate measurements of relaxation times depend on several factors, such as imaging sequences used, different models for the signal fitting, and measurement conditions, that is, temperature of the samples, etc.27 Therefore, slight differences in T1 and T2 times measured at different sites using different methodologies may be present and have to be acknowledged in such studies.40 Besides, other factors can cause systematic errors that can compromise the accuracy of the T1 and T2 maps, such as noise, partial volume effect, local field inhomogeneities (B1 effects), and spoiling.27 However, we assume that the main reason for the high SD for samples with a lower infill density is the higher air content and a smaller percentage of the material within these phantoms giving low MR signal (low SNR), which increases dispersion of relaxation time data. This demonstrates that materials with high air content may not be suitable for accurate MRI measurements and that the selection of the proper ratio between air and materials is crucial for our study. To address this limitation, a future study will explore the capabilities of our custom-made multi-material printer, which features three printheads capable of printing silicone rubber alongside viscous liquids such as silicone oil and thermoplastic filament in a single print.21,22,41 Incorporating viscous liquids into the printed silicone structure may not only reduce high SD values but also allow for fine-tuning of MRI signal properties. This could be achieved by using liquid materials or additives with specific MRI characteristics, such as contrast agents. In addition, investigating a potential match of the mechanical properties of printed silicone and multi-material samples with the MRI signal properties, for example, as proposed in another paper,42 is also another future prospect for this research. Certain infill structures or fluid fillings can result in matching MRI signal properties and mechanical properties of certain tissue. In such cases, MRI contrast and mechanically realistic models can be created, which can be particularly useful in surgical training or image-guided procedures where flexible phantoms are of importance. This would also increase the dimensions of the print according to previously used definitions,43–45 where every additional local information taken into account in the printed part was defined as another dimension. For example, changes in tumor size or physiology were color-coded,43 or material composition as well as magnetic particle orientation were controlled during the print,44 both resulting in “5D-printed” objects— similarly to our proposed technology, taking into account MRI-signal properties as well as mechanical properties. In the case of such image-based, patient-specific additional dimensions, this approach has been shown to increase the value of 3D-printed phantoms for surgical planning43 and it has even been proposed for the advancement of personal medicine in in vivo applications.45
5. Conclusion
3D printing technology has revolutionized the creation of medical imaging phantoms, recently offering advantages in replicating tissue properties for MRI studies. This study highlights the ability of 3D-printed phantoms, particularly those made from silicone with varying infill densities, to accurately mimic the T1 and T2 relaxation times of human soft tissues. By achieving a broad range of relaxation times, these MRI phantoms facilitate the optimization of imaging sequences, improve the consistency of image quality across different systems, and support standardizing radiomics analysis for multicenter studies to ensure its reproducibility. This research demonstrates that 3D printing can produce flexible, realistic MRI phantoms, enhancing their utility in clinical and research settings, particularly for applications requiring the simulation of anatomical deformations. Future research will focus on refining these methods to reduce measurement variability and further enhance the material properties of the phantoms.
1.van der Heide UA, Frantzen-Steneker M, Astreinidou E, Nowee ME, van Houdt PJ. MRI basics for radiation oncologists. Clin Transl Radiat Oncol. 2019;18:74-79.
doi: 10.1016/j.ctro.2019.04.008
2.Tagliafico AS, Piana M, Schenone D, Lai R, Massone AM, Houssami N. Overview of radiomics in breast cancer diagnosis and prognostication. Breast. 2020;49:74-80.
doi: 10.1016/j.breast.2019.10.018
3.Hatamikia S, George G, Schwarzhans F, Mahbod A, Woitek R. Breast MRI radiomics and machine learning-based predictions of response to neoadjuvant chemotherapy - how are they affected by variations in tumor delineation? Comput Struct Biotechnol J. 2023;23:52-63.
doi: 10.1016/j.csbj.2023.11.016
4.Bianchini L, Botta F, Origgi D, et al. PETER PHAN: an MRI phantom for the optimisation of radiomic studies of the female pelvis. Phys Med. 2020;71:71-81.
doi: 10.1016/j.ejmp.2020.02.003
5.Gallivanone F, D’Ambrosio D, Carne I, et al. A tri-modal tissue-equivalent anthropomorphic phantom for PET, CT and multi-parametric MRI radiomics. Phys Med. 2022;98:28-39.
doi: 10.1016/j.ejmp.2022.04.007
6.Lee J, Steinmann A, Ding Y, et al. Radiomics feature robustness as measured using an MRI phantom. Sci Rep. 2021;11(1):3973.
doi: 10.1038/s41598-021-83593-3
7.Filippou V, Tsoumpas C. Recent advances on the development of phantoms using 3D printing for imaging with CT, MRI, PET, SPECT, and ultrasound. Med Phys. 2018;45(9):e740-e760.
doi: 10.1002/mp.13058
8.Kut C, Kao T, Morcos M, Kim Y, Boctor E, Viswanathan AN. 3D-printed magnetic resonance (MR)-based gynecological phantom for image-guided brachytherapy training. Brachytherapy. 2022;21(6):799-805.
doi: 10.1016/j.brachy.2022.07.005
9.Altermatt A, Santini F, Deligianni X, et al. Design and construction of an innovative brain phantom prototype for MRI. Magn Reson Med. 2019;81(2):1165-1171.
doi: 10.1002/mrm.27464
10.Cox BL, Ludwig KD, Adamson EB, Eliceiri KW, Fain SB. An open source, 3D printed preclinical MRI phantom for repeated measures of contrast agents and reference standards. Biomed Phys Eng Express. 2018;4(2):027005.
11.Cho HM, Cheolpyo H, Changwoo L, Ding H, Taeho K, Ahn B. LeGo-compatible modular mapping phantom for magnetic resonance imaging. Sci Rep. 2020;10:14755.
doi: 10.1038/s41598-020-71279-1
12.Mitsouras D, Lee TC, Liacouras P, et al. Three-dimensional printing of MRI-visible phantoms and MR image-guided therapy simulation. Magn Reson Med. 2017;77(2):613-622.
doi: 10.1002/mrm.26136
13.Rai R, Holloway LC, Brink C, et al. Multicenter evaluation of MRI-based radiomic features: a phantom study. Med Phys. 2020;47(7):3054-3063.
doi: 10.1002/mp.14173
14.Rausch I, Valladares A, Sundar LKS, et al. Standard MRI-based attenuation correction for PET/MRI phantoms: a novel concept using MRI-visible polymer. EJNMMI Phys. 2021;8(1):18.
doi: 10.1186/s40658-021-00364-9
15.Rai R, Wang YF, Manton D, Dong B, Deshpande S, Liney GP. Development of multi-purpose 3D printed phantoms for MRI. Phys Med Biol. 2019;64(7):075010.
16.Valladares A, Oberoi G, Berg A, Beyer T, Unger E, Rausch I. Additively manufactured, solid object structures for adjustable image contrast in magnetic resonance imaging. Z Med Phys. 2022;32(4):466-476.
doi: 10.1016/j.zemedi.2022.03.003
17.Yunker BE, Stupic KF, Wagner JL, et al. Characterization of 3-dimensional printing and casting materials for use in magnetic resonance imaging phantoms at 3 T. J Res Natl Inst Stand Technol. 2020;vol:125028.
doi: 10.6028/jres.125.028
18.Rai R, Manton D, Jameson MG, et al. 3D printed phantoms mimicking cortical bone for the assessment of ultrashort echo time magnetic resonance imaging. Med Phys. 2018;45(2):758-766.
doi: 10.1002/mp.12727
19.Jiangfeng Q, Kun H, Brandon AD, et al. Constructing customized multimodal phantoms through 3D printing: a preliminary evaluation. Front Phys. 2021;9:605630.
20.Woletz M, Chalupa‐Gantner F, Hager B, et al. Toward printing the brain: a microstructural ground truth phantom for MRI. Adv Mater Technol. 2024;9(3):2300176.
21.Hatamikia S, Jaksa L, Kronreif G, et al. Silicone phantoms fabricated with multi-material extrusion 3D printing technology mimicking imaging properties of soft tissues in CT. Z Med Phys. 2023;S0939-3889,26(23)00076-4.
doi: 10.1016/j.zemedi.2023.05.007
22.Jaksa L, Aryeetey OJ, Hatamikia S, et al. 3D-Printed multimaterial liver model with simultaneous mechanical and radiological tissue-mimicking features for improved realism. Int J Bioprint. 2023;9(4):721.
doi: 10.18063/ijb.721
23.Hatamikia S, Kronreif G, Unger A, et al. 3D printed patientspecific thorax phantom with realistic heterogenous bone radiopacity using filament printer technology. Z Med Phys. 2022;32(4):438-452.
doi: 10.1016/j.zemedi.2022.02.001
24.Chen Y, Panda A, Pahwa S, et al. Three-dimensional MR fingerprinting for quantitative breast imaging. Radiology. 2019;290(1):33-40.
doi: 10.1148/radiol.2018180836
25.Fram EK, Herfkens RJ, Johnson GA, et al. Rapid calculation of T1 using variable flip angle gradient refocused imaging. Magn Reson Imaging. 1987;5(3):201-208.
doi: 10.1016/0730-725x(87)90021-x
26.Poon CS, Henkelman RM. Practical T2 quantitation for clinical applications. J Magn Reson Imaging. 1992;2(5):541-553.
27.Bojorquez JZ, Bricq S, Acquitter C, Brunotte F, Walker PM, Lalande A. What are normal relaxation times of tissues at 3 T? Magn Reson Imaging. 2017;35:69-80.
doi: 10.1016/j.mri.2016.08.021
28.Carr ME, Keenan KE, Rai R, Metcalfe P, Walker A, Holloway L. Determining the longitudinal accuracy and reproducibility of T1 and T2 in a 3T MRI scanner. J Appl Clin Med Phys. 2021;22(11):143-150.
doi: 10.1002/acm2.13432
29.De Bazelaire CMJ, Duhamel GD, Rofsky NM, Alsop DC. MR imaging relaxation times of abdominal and pelvic tissues measured in vivo at 3.0 T: preliminary results. Radiology. 2004;230(3):652-659.
doi: 10.1148/radiol.2303021331
30.Gold GE, Han E, Stainsby J, Wright G, Brittain J, Beaulieu C. Musculoskeletal MRI at 3.0 T: relaxation times and image contrast. AJR Am J Roentgenol. 2004;183(2):343-351.
doi: 10.2214/ajr.183.2.1830343
31.Chen Y, Jiang Y, Pahwa S, et al. MR fingerprinting for rapid quantitative abdominal imaging. Radiology. 2016;279(1):278-286.
doi: 10.1148/radiol.2016152037
32.Fennessy FM, Fedorov A, Gupta SN, Schmidt EJ, Tempany CM, Mulkern RV. QIN: practical considerations in T1 mapping of prostate for dynamic contrast enhancement pharmacokinetic analyses. Magn Reson Imaging. 2012;30(9):1224-1233.
doi: 10.1016/j.mri.2012.06.011
33.Piechnik SK, Ferreira VM, Dall’Armellina E, et al. Shortened modified Look–Locker inversion recovery (shmolli) for clinical myocardial t1-mapping at 1.5 and 3 twithin a 9 heartbeat breathhold. J Cardiovasc Magn Reson. 2010;12(1):69.
34.Shin W, Gu H, Yang Y. Fast high-resolution T1 mapping using inversion-recovery look–locker echo-planar imaging at steady state: optimization for accuracy and reliability. Magn Reson Med. 2009;61(4):899-906.
doi: 10.1002/mrm.21836
35.Chen L, Bernstein M, Huston J, Fain S. Measurements of T1 relaxation times at 3.0 T: implications for clinical MRA. Proceedings International Society for. Magn Reson Med. 2001:1.
36.Bojorquez JZ, Bricq S, Brunotte F, Walker PM, Lalande AA. A novel alternative to classify tissues from T 1 and T 2 relaxation times for prostate MRI. Magn Reason Mater Phys Biol Med. 2016;29(5):1–12.
doi: 10.1007/s10334-016-0562-3
37.Van Heeswijk RB, Feliciano H, Bongard C, et al. Freebreathing 3 T magnetic resonance T2-mapping of the heart. J Am Coll Cardiol Imaging. 2012;5(12):1231-1239.
doi: 10.1016/j.jcmg.2012.06.010
38.Rakow-Penner R, Daniel B, Yu H, Sawyer-Glover A, Glover GH. Relaxation times of breast tissue at 1.5 T and 3 T measured using IDEAL. J Magn Reson Imaging. 2006;23(1):87-91.
doi: 10.1002/jmri.20469
39.Jiang Y, Ma D, Seiberlich N, Gulani V, Griswold MAMR. Fingerprinting using fast imaging with steady state precession (FISP) with spiral readout. Magn Reason Med. 2015;74(6):1621-1631.
doi: 10.1002/mrm.25559
40.Bidhult S, Kantasis G, Aletras AH, Arheden H, Heiberg E, Hedström E. Validation of T1 and T2 algorithms for quantitative MRI: performance by a vendor-independent software. BMC Med Imaging. 2016;16(1):46.
doi: 10.1186/s12880-016-0148-6
41.Jaksa L, Pahr D, Kronreif G, Lorenz A. Development of a multi-material 3D printer for functional anatomic models. Int J Bioprint. 2021;7(4):420.
42.James Aryeetey O, Jaksa l, Bittner-Frank M, Lorenz A, Pahr DH. Development of 3D printed tissue-mimicking materials: Combining fiber reinforcement and fluid content for improved surgical rehearsal. Materialia. 2024; 34:102088.
doi: 10.1016/j.mtla.2024.102088
43.Gillaspie EA, Matsumoto JS, Morris NE, et al. From 3-dimensional printing to 5-dimensional printing: enhancing thoracic surgical planning and resection of complex tumors. Ann Thorac Surg. 2016;101(5):1958-1962.
doi: 10.1016/j.athoracsur.2015.12.075
44.Kokkinis D, Schaffner M, Studart A. Multimaterial magnetically assisted 3D printing of composite materials. Nat Commun. 2015;6:8643.
doi: 10.1038/ncomms9643
45.Foresti R, Rossi S, Pinelli S, et al. In-vivo vascular application via ultra-fast bioprinting for future 5D personalised nanomedicine. Sci Rep. 2020;10:3205.